
Mathematics, 13.08.2020 21:01 zahradawkins2007
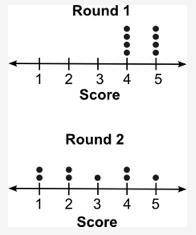
The dot plots below show the scores for a group of students for two rounds of a quiz: Which of the following inferences can be made using the dot plots? The range of round 2 is greater than the round 1 range. Round 2 scores are higher than round 1 scores. Round 1 scores are lower than round 2 scores. There is no overlap between the data.

Answers: 2


Other questions on the subject: Mathematics
Mathematics, 21.06.2019 18:00, whaddup8428
Carmen begins her next painting on a rectangular canvas that is 82.7 cm long and has a area of 8,137.68 cm2. will the painting fit in a frame with an opening that is 82.7 cm long and 95 cm wide? explain
Answers: 3
You know the right answer?
The dot plots below show the scores for a group of students for two rounds of a quiz: Which of the f...
Questions in other subjects:

Biology, 14.07.2020 01:01
Mathematics, 14.07.2020 01:01


Mathematics, 14.07.2020 01:01


