
Mathematics, 12.08.2020 08:01 hendersontianna05
Worth 20pts need help right away
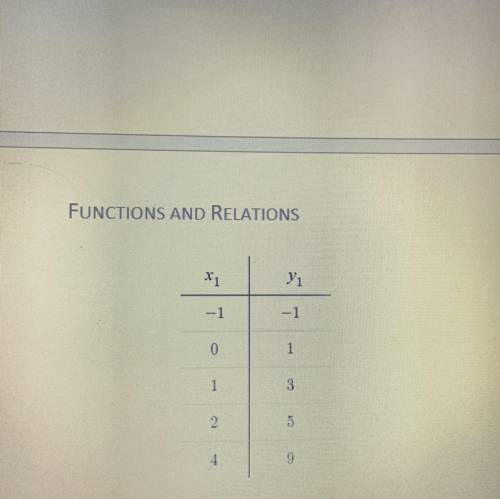
Q. Make an equation that describes the table of values below
Ps pls explain work it’s worth 20 pts

Answers: 1


Other questions on the subject: Mathematics
Mathematics, 21.06.2019 12:50, xojade
Plz, ! the box plot below shows the total amount of time, in minutes, the students of a class surf the internet every day: a box plot is shown. part a: list two pieces of information that are provided by the graph and one piece of information that is not provided by the graph. (4 points) part b: calculate the interquartile range of the data, and explain in a sentence or two what it represents. (4 points) part c: explain what affect, if any, there will be if an outlier is present. (2 points)
Answers: 3
Mathematics, 21.06.2019 14:00, kah36
When drawing a trend line for a series of data on a scatter plot, which of the following is true? a. there should be an equal number of data points on either side of the trend line. b. all the data points should lie on one side of the trend line. c. the trend line should not intersect any data point on the plot. d. the trend line must connect each data point on the plot.
Answers: 2
Mathematics, 21.06.2019 18:30, avahrhey24
Sketch one cycle if the cosine function y=2cos2theta
Answers: 1
Mathematics, 21.06.2019 21:00, JamlessJimin
The radius of a sphere is 3 inches. which represents the volume of the sphere?
Answers: 1
You know the right answer?
Worth 20pts need help right away
Q. Make an equation that describes the table of values below
Questions in other subjects:

Mathematics, 04.07.2019 01:30

History, 04.07.2019 01:30


