
Mathematics, 12.08.2020 08:01 jjtfeb11
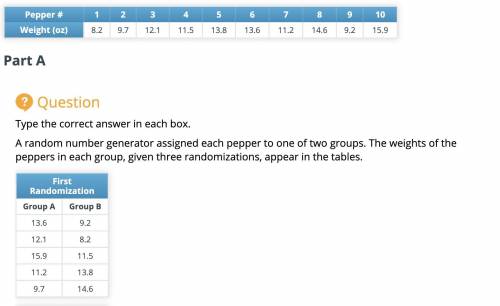
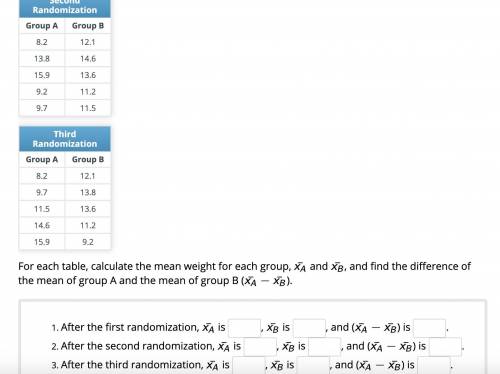
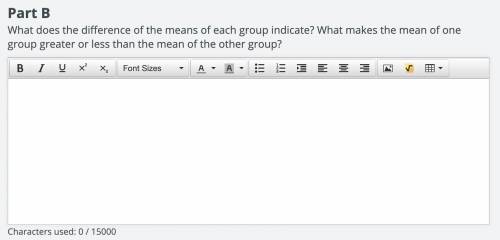
Performing a Re-randomization Simulation In this activity, you’ll perform a re-randomization simulation to determine whether the difference of the sample means is statistically significant to be attributed to the treatment. Suppose you have 10 green bell peppers of various sizes that have been part of an experimental study. The study involved treating the peppers with a nutrient supplement that would produce larger and heavier peppers. To test the supplement, only 5 out of 10 peppers were treated with the supplement. All 10 peppers were of the same variety and grown under similar conditions, other than the treatment applied to 5 of the peppers. Your task is to examine the claim that the nutrient supplement yields larger peppers. You will base your conclusions on the weight data of the peppers. The table shows the weights of the 10 peppers, in ounces. (Note: Do not be concerned with which peppers received the treatment for right now.) In this task, you’ll divide the data into two portions several times, take their means, and find the differences of the means. This will create a set of differences of means that you can analyze to see if the treatment was successful.

Answers: 2


Other questions on the subject: Mathematics
Mathematics, 21.06.2019 15:00, JayJay9439
Listed in the table is the percentage of students who chose each kind of juice at lunchtime. use the table to determine the measure of the central angle you would draw to represent orange juice in a circle graph
Answers: 3
Mathematics, 22.06.2019 01:50, catsRlife4573
Algebraically prove that a clockwise and counterclockwise rotation of 180° about the origin for triangle abc are equivalent rotations.
Answers: 2
You know the right answer?
Performing a Re-randomization Simulation In this activity, you’ll perform a re-randomization simulat...
Questions in other subjects:

Mathematics, 05.05.2020 15:24

Chemistry, 05.05.2020 15:25

Mathematics, 05.05.2020 15:25

Business, 05.05.2020 15:25
Mathematics, 05.05.2020 15:25


