
Mathematics, 12.08.2020 08:01 Squara
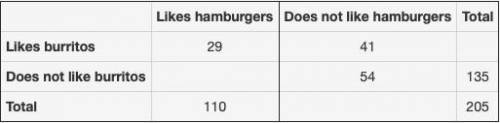
* The food truck did a daily survey of customers to find their food preferences. The data is partially entered in the frequency table. Complete the table to analyze the data and answer the questions: *table shown below* Part A: What percentage of the survey respondents did not like either hamburgers or burritos? (2 points) Part B: Create a relative frequency table and determine what percentage of students who like hamburgers also like burritos. (3 points) Part C: Use the conditional relative frequencies to determine which two data point has the strongest association of its two factors. Use complete sentences to explain your answer. (5 points)

Answers: 1


Other questions on the subject: Mathematics
Mathematics, 21.06.2019 16:00, lLavenderl
5,600 x 10^3 = a) 560 b) 5,000,600 c) 5,600,000 d) 56,000
Answers: 2
Mathematics, 21.06.2019 22:00, vipergod07
Four quarts of a latex enamel paint will cover about 200 square feet of wall surface. how many quarts are needed to cover 98 square feet of kitchen wall and 52 square feet of bathroom wall
Answers: 1
Mathematics, 22.06.2019 02:30, QueenNerdy889
Which statement best explains whether the table represents a linear or nonlinear function? input (x) output (y) 2 5 4 10 6 15 8 20 it is a linear function because the input values are increasing. it is a nonlinear function because the output values are increasing. it is a linear function because there is a constant rate of change in both the input and output. it is a nonlinear function because there is a constant rate of change in both the input and output.
Answers: 3
Mathematics, 22.06.2019 03:30, ryleepretty
15. jiovanni is looking in to two different companies that offer study guides for math exams. test prep 101 charges a $5 flat fee and an additional $0.25 per problem. math charges a $2 flat fee and an additional $0.50 per problem. how many prablems would make the costs of the two companies be equal? varibles: equations/eniqualities{ {
Answers: 1
You know the right answer?
* The food truck did a daily survey of customers to find their food preferences. The data is partial...
Questions in other subjects:

History, 08.01.2021 03:10

English, 08.01.2021 03:10
Mathematics, 08.01.2021 03:10
History, 08.01.2021 03:10
Mathematics, 08.01.2021 03:10


Health, 08.01.2021 03:10


