Which of the following best describes the graph shown below?
16
A1
1
14
O A...

Mathematics, 12.08.2020 05:01 mandyO1
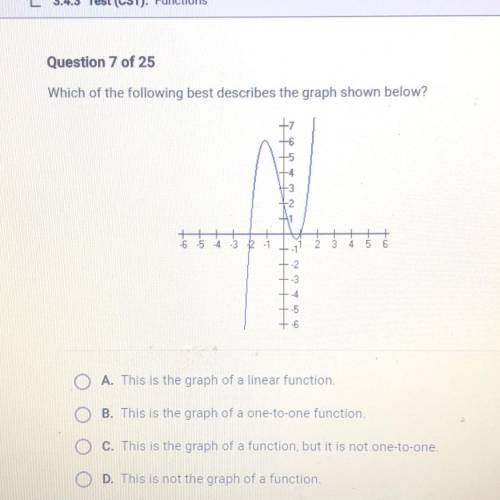
Which of the following best describes the graph shown below?
16
A1
1
14
O A This is the graph of a linear function
B. This is the graph of a one-to-one function
C. This is the graph of a function, but it is not one to one
D. This is not the graph of a function

Answers: 1


Other questions on the subject: Mathematics
Mathematics, 21.06.2019 22:20, twentyonepilots12018
Which of the following equations are equivalent to -2m - 5m - 8 = 3 + (-7) + m? -15m = -4m -7m - 8 = m - 4 -3m - 8 = 4 - m m - 4 = -7m - 8 -8 - 7m = -4 + m -8 - 3m = 4 - m
Answers: 1
Mathematics, 22.06.2019 02:00, sky724
Need to finish my juan wants to build a greenhouse in his back yard. he needs to maximize the ratio of floor area to structure volume in order to provide the most room for plants while minimizing the area to be heated. find the description of the structure that best meets juan’s criteria. a.) a hemisphere with a diameter of 12 feet b.) a cube with a side length of 12 feet c.) a cone with a diameter of 12 feet and a height of 10 feet d.) a square pyramid with a base side length of 12 feet and a height of 9 feet
Answers: 1
You know the right answer?
Questions in other subjects:
Mathematics, 15.08.2020 22:01

Biology, 15.08.2020 22:01
Mathematics, 15.08.2020 22:01
Mathematics, 15.08.2020 22:01

Chemistry, 15.08.2020 22:01


