
Mathematics, 12.08.2020 06:01 MustafaEtroshi
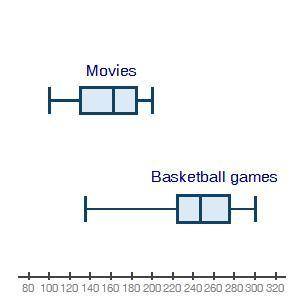
PLEASE HELP I WILL GIVE BRAINLIEST The box plots below show attendance at a local movie theater and high school basketball games: Two box plots are shown. The top one is labeled Movies. Minimum at 100, Q1 at 130, median at 165, Q3 at 185, maximum at 200. The bottom box plot is labeled Basketball games. Minimum at 135, Q1 at 225, median at 248, Q3 at 275, maximum at 300. Which of the following best describes how to measure the spread of the data? The IQR is a better measure of spread for movies than it is for basketball games. The standard deviation is a better measure of spread for movies than it is for basketball games. The IQR is the best measurement of spread for games and movies. The standard deviation is the best measurement of spread for games and movies.

Answers: 3


Other questions on the subject: Mathematics
Mathematics, 21.06.2019 19:30, priscilaannmendez
We just started the introduction into circles and i have no idea how to do this.
Answers: 3
Mathematics, 21.06.2019 22:00, costel8532
Which of the following graphs could represent a cubic function?
Answers: 1
You know the right answer?
PLEASE HELP I WILL GIVE BRAINLIEST The box plots below show attendance at a local movie theater and...
Questions in other subjects:

History, 24.10.2021 08:50


Social Studies, 24.10.2021 08:50

Social Studies, 24.10.2021 08:50


