
Mathematics, 12.08.2020 06:01 artiomtyler007
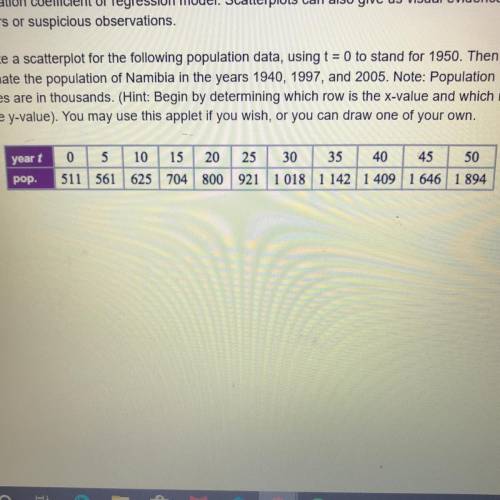
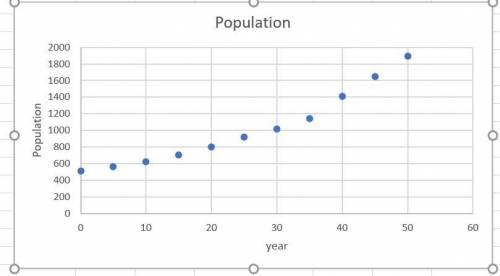
Create a scatterplot for the following population data, using t = 0 to stand for 1950. Then
estimate the population of Namibia in the years 1940, 1997, and 2005. Note: Population
values are in thousands. (Hint: Begin by determining which row is the x-value and which row
is the y-value)

Answers: 2


Other questions on the subject: Mathematics
Mathematics, 21.06.2019 20:00, anabelleacunamu
Find the value of x. round the length to the nearest tenth
Answers: 1
Mathematics, 21.06.2019 20:30, aceccardi03
Can someone me with #s 8, 9, and 11. with just one of the three also works. prove using only trig identities.
Answers: 3
You know the right answer?
Create a scatterplot for the following population data, using t = 0 to stand for 1950. Then
estimat...
Questions in other subjects:

Geography, 13.12.2019 22:31

Social Studies, 13.12.2019 22:31


