
Mathematics, 03.08.2020 14:01 gilcarrillo146
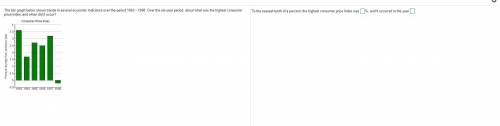
The bar graph below shows trends in several economic indicators over the period . Over the six-year period, about what was the highest consumer price index, and when did it occur? Need help with both questions!

Answers: 1


Other questions on the subject: Mathematics
Mathematics, 21.06.2019 14:40, cbbentonam72
Simplify.7x + 3y - 2 + 6x + 1 + y squared 2 you! ; )
Answers: 1
Mathematics, 21.06.2019 15:10, hannahbaak
12x + 1 = 25 solve the following equation. then place the correct number in the box provided.
Answers: 2
Mathematics, 21.06.2019 20:10, lele142018
Which value of m will create a system of parallel lines with no solution? y = mx - 6 8x - 4y = 12
Answers: 3
Mathematics, 21.06.2019 20:50, jahootey2798
You need to solve a system of equations. you decide to use the elimination method. which of these is not allowed? 3x - 2y = 7 3x + 4y = 17 equation 1 equation 2
Answers: 1
You know the right answer?
The bar graph below shows trends in several economic indicators over the period . Over the six-year...
Questions in other subjects:

English, 25.10.2019 04:43

Social Studies, 25.10.2019 04:43

Chemistry, 25.10.2019 04:43
Mathematics, 25.10.2019 04:43
Mathematics, 25.10.2019 04:43


Biology, 25.10.2019 04:43


