
Mathematics, 30.07.2020 21:01 tressasill
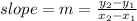
He line of best fit for a scatter plot is shown below:
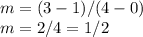
A scatter plot and line of best fit are shown. Data points are located at 0 and 1, 2 and 1, 2 and 3, 4 and 3, 4 and 5, 6 and 3, 7 and 5, 9 and 4. A line of best fit passes through the y-axis at 1 and through the point 4 and 3.
What is the equation of this line of best fit in slope-intercept form?

Answers: 1


Other questions on the subject: Mathematics
Mathematics, 21.06.2019 19:00, ALEXMASTERS64
Moira has a canvas that is 8 inches by 10 inches. she wants to paint a line diagonally from the top left corner to the bottom right corner. approximately how long will the diagonal line be?
Answers: 1
Mathematics, 21.06.2019 20:30, kuddlebugsmommy
Martha has a deck of cards. she has lost some of the cards, and now the deck only contains nine spades, eleven diamonds, eight clubs, and twelve hearts. martha predicts that whenever she draws a card from the deck without looking, she will draw a club one-fifth of the time. which activity would best allow martha to test her prediction? a. randomly draw a card from the box and see if it is a club. b. randomly draw a card. then, continue to draw another card until all eight clubs are drawn. c. randomly draw and replace a card 120 times. then, observe how close to 30 times a club is drawn. d. randomly draw and replace a card 100 times. then, observe how close to 20 times a club is drawn.
Answers: 1
You know the right answer?
He line of best fit for a scatter plot is shown below:
A scatter plot and line of best fit are show...
Questions in other subjects:

Physics, 01.12.2020 02:40
Mathematics, 01.12.2020 02:40

History, 01.12.2020 02:40

Physics, 01.12.2020 02:40
History, 01.12.2020 02:40

Mathematics, 01.12.2020 02:40
Physics, 01.12.2020 02:40


