
Mathematics, 30.07.2020 14:01 jibjabsalar1212
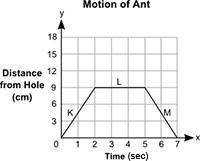
The distance, y, in centimeters, of an ant from a hole in the tree for a certain amount of time, x, in seconds, is shown in the graph: A graph titled Motion of Ant is shown. The graph shows time in seconds on the x-axis and the Distance from Hole in centimeters on the y-axis. The scale on the x-axis is shown from 0 to 6 at increments of 1, and the scale on the y-axis is shown from 0 to 18 at increments of 3. The graph has 3 straight lines. The first line is labeled K and joins ordered pairs 0, 0 and 2, 9. The second line is labeled L and joins ordered pairs 2, 9 and 5, 9. The third line is labeled M and joins ordered pairs 5, 9 and 7, 0. Part A: Is the graph linear or nonlinear? Explain your answer. (2 points) Part B: In which segments is the graph increasing, decreasing, and constant? (3 points) Part C: In your own words, describe the motion of the ant, as shown on the graph. (5 points)

Answers: 1


Other questions on the subject: Mathematics
Mathematics, 21.06.2019 12:30, ulilliareinhart2
What is the approximate total length of iron edging needed to create the square frame and the two diagonals?
Answers: 3
You know the right answer?
The distance, y, in centimeters, of an ant from a hole in the tree for a certain amount of time, x,...
Questions in other subjects:
Mathematics, 14.02.2020 03:13
Mathematics, 14.02.2020 03:13


Mathematics, 14.02.2020 03:14
Mathematics, 14.02.2020 03:15


