
Mathematics, 28.07.2020 07:01 sunny6946
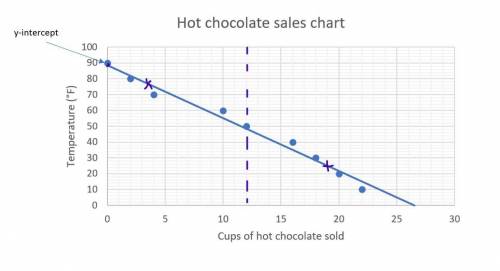
Will give most points(06.02)Jordan plotted the graph below to show the relationship between the temperature of his city and the number of cups of hot chocolate he sold daily
Jordan's Hot Chocolate Sales
22
20
18
16
12
Cups of Hot Chocolate Sold
10
4
2
0 10 20 30 40 50 60 70 80 90
Temperature (°F)
Part A: In your own words, describe the relationship between the temperature of the city and the number of cups of hot chocolate sold. (2 points)
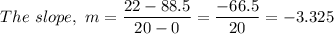
Part B: Describe how you can make the line of best fit. Write the approximate slope and y-intercept of the line of best fit. Show your work, including the point

Answers: 2


Other questions on the subject: Mathematics
Mathematics, 21.06.2019 19:20, TrudnEli1217
Which number completes the system of linear inequalities represented by the graph? y> 2x – 2 and x + 4y 2 et 2 3 4
Answers: 3
Mathematics, 22.06.2019 02:30, ImmortalEnigmaYT
Translate the algebraic expression shown below into a verbal expression. fraction with variable x in numerator and 6 in the denominator. the sum of six and some number the product of six and some number the quotient of some number and six the difference of six and some number
Answers: 1
Mathematics, 22.06.2019 02:40, crybaby222psyc
Given the lease terms below, what monthly lease payment can you expect on this vehicle? terms: •length of lease: 60 months •msrp of the car: $28,500 •purchase value of the car after lease: $12,900 •down payment: $1900 •lease factor: 0.0005 •security deposit: $375 •aquisition fee: $300 a.$232.50 b.$279.99 c.$227.50 d.$248.08
Answers: 2
You know the right answer?
Will give most points(06.02)Jordan plotted the graph below to show the relationship between the temp...
Questions in other subjects:


Health, 07.01.2020 00:31

Mathematics, 07.01.2020 00:31
Mathematics, 07.01.2020 00:31

Mathematics, 07.01.2020 00:31
Mathematics, 07.01.2020 00:31


