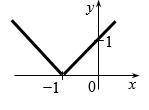
Write an algebraic equation to match each graph. (These graphs are not drawn to scale!)
...

Mathematics, 28.07.2020 18:01 csterner101
Write an algebraic equation to match each graph. (These graphs are not drawn to scale!)

Answers: 2


Other questions on the subject: Mathematics
Mathematics, 21.06.2019 19:00, alkaline27
Amodel rocket is launched from a roof into a large field. the path of the rocket can be modeled by the equation y = -0.04x^2 + 8.6x + 4.8, where x is the horizontal distance, in meters, from the starting point on the roof and y is the height, in meters, of the rocket above the ground. how far horizontally from its starting point will the rocket land? a. 0.56 m b. 215.56 m c. 431.11 m d. 215.74 m
Answers: 1
Mathematics, 21.06.2019 20:50, peachijmin
These tables represent a quadratic function with a vertex at (0, -1). what is the average rate of change for the interval from x = 9 to x = 10?
Answers: 2
Mathematics, 22.06.2019 03:30, sbailey0962
Runners run around the school's football field. the cross country coach determines that the width of the field is seventy yards shorter than the length. part a write an expression that represents the perimeter of the football field. let x represent the length of the football field. include parentheses in your expression. next, write an equivalent expression that does not include parentheses. what property or properties did you use to simplify? explain. part b the cross country coach later determines that the length of the football field is 120 yards. all students must run five laps. using your answer from part a, determine the actual number of yards that each athlete must run in the tryouts. in order to make the team, students must complete the laps in 6 minutes. how quickly must they run each lap?
Answers: 3
Mathematics, 22.06.2019 04:30, ashton3952525
The survey of study habits and attitudes (ssha) is a psychological test that measures the motivation, attitude toward school, and study habits of students, scores range from 0 to 200. the mean score for u. s. college students is about 115, and the standard deviation is about 30. a teacher who suspects that older students have better attitudes toward school gives the ssha to 55 students who are at least 30 years of age. the mean score is 113.2. assume the population standard deviation is 30 for older students what is the margin of error for a 95% confidence interval for the population mean score for a. older students? b. compute the 95% confidence interval for the population mean score for older students. c. compute the 99% confidence interval for the population mean score for older students. d. compute the 88% confidence interval for the population mean score for older students.
Answers: 3
You know the right answer?
Questions in other subjects:

Biology, 22.06.2019 15:30
Mathematics, 22.06.2019 15:30

History, 22.06.2019 15:30


Geography, 22.06.2019 15:40


