
Mathematics, 28.07.2020 02:01 florochoa217
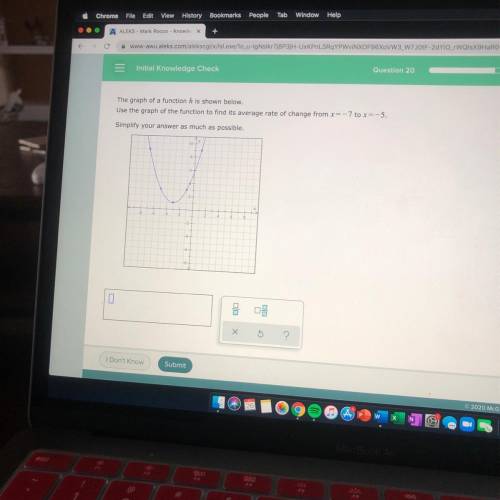
HELP ASAP The graph of a function h is shown below. Use the graph to find its average rate of change from x=-7 to x=-5. Simplify your answer as much as possible

Answers: 3


Other questions on the subject: Mathematics
Mathematics, 21.06.2019 18:00, tasnimsas3
Plz a. s. a. p. the table shows the number of male and female contestants who did not win a prize. what is the probability that a randomly selected contestant won a prize, given that the contestant was female? write the probability as a percent. round to the neares tenth, if needed.
Answers: 1
Mathematics, 21.06.2019 21:30, Travon6524
Ten members of balin's soccer team ran warm ups for practice. each member ran the same distance. their combined distance was 5/6 of a mile. to find the distance that each member ran, balin wrote the expression below.
Answers: 3
You know the right answer?
HELP ASAP The graph of a function h is shown below. Use the graph to find its average rate of change...
Questions in other subjects:


World Languages, 04.04.2020 04:19

Mathematics, 04.04.2020 04:20


