
Mathematics, 26.07.2020 01:01 chrisraptorofficial
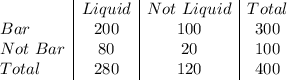
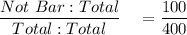
The table shows the results of a survey of 400 random people on whether they like liquid soap, bar soap, or both. A 4-column table with 3 rows. The first column has no label with entries bar, not bar, total. The second column is labeled liquid with entries 200, 80, 280. The third column is labeled not liquid with entries 100, 20, 120. The fourth column is labeled total with entries 300, 100, 400. Which is the marginal relative frequency for the people who do not like bar soap? StartFraction 100 Over 400 EndFraction StartFraction 120 Over 400 EndFraction StartFraction 280 Over 400 EndFraction StartFraction 300 Over 400 EndFraction

Answers: 1


Other questions on the subject: Mathematics
Mathematics, 22.06.2019 01:30, Laners0219
Which represents the number of times all outcomes less than a given outcome occur? cumulative frequency relative frequency frequency cumulative relative frequency
Answers: 3
You know the right answer?
The table shows the results of a survey of 400 random people on whether they like liquid soap, bar s...
Questions in other subjects:
Mathematics, 07.04.2021 19:40
Mathematics, 07.04.2021 19:40
Mathematics, 07.04.2021 19:40

Chemistry, 07.04.2021 19:40

Mathematics, 07.04.2021 19:40
Mathematics, 07.04.2021 19:40


