
Mathematics, 25.07.2020 22:01 heroicblad
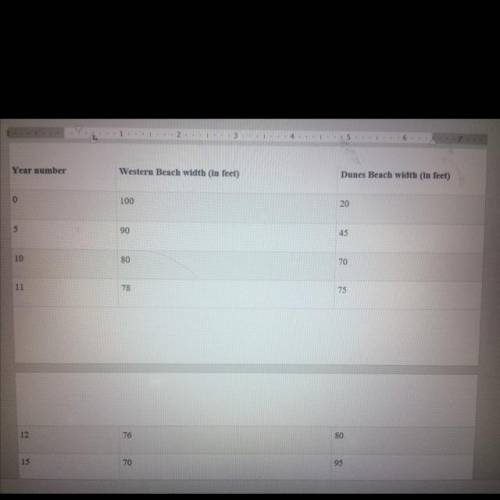
Two ocean beaches are being affected by erosion. The table shows the width in feet of each beach at high tide measured where 1995 is represented by year 0.
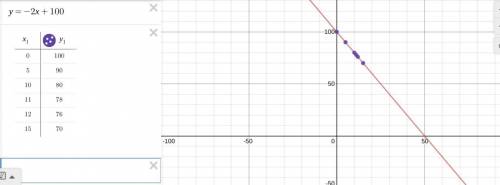
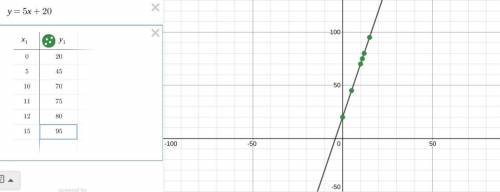
A. Describe the patterns shown by the erosion data measurements shown for each of the beaches in the table.
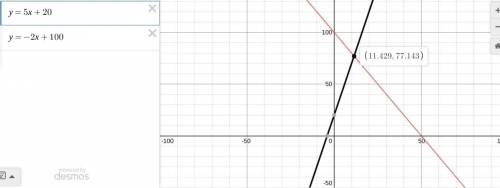
B. Between which years will the beaches have approximately the same width?
C. Assuming these rates remain constant, what can you do to get a better approximation of when the two beaches will have the same width?

Answers: 2


Other questions on the subject: Mathematics
Mathematics, 22.06.2019 02:30, Raekwon3232
Write the equation of the line that passes through (3, 4) and (2, −1) in slope-intercept form. (2 points) y = 3x − 7 y = 3x − 5 y = 5x − 11 y = 5x − 9
Answers: 1
You know the right answer?
Two ocean beaches are being affected by erosion. The table shows the width in feet of each beach at...
Questions in other subjects:


English, 17.02.2020 22:28


