
Mathematics, 24.07.2020 20:01 oliviaciscooc
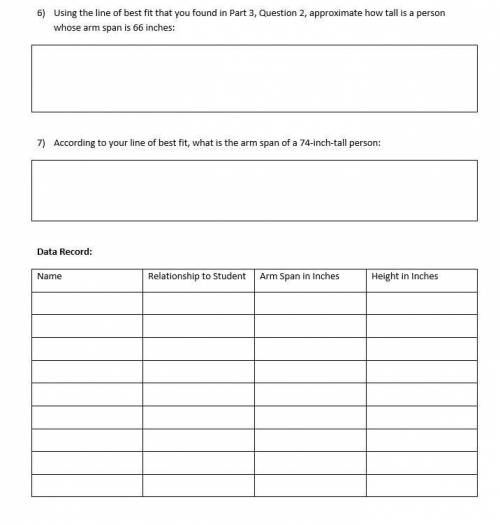
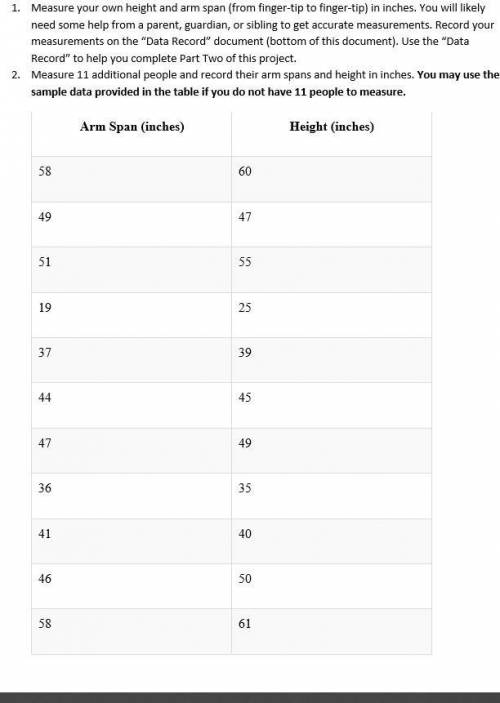
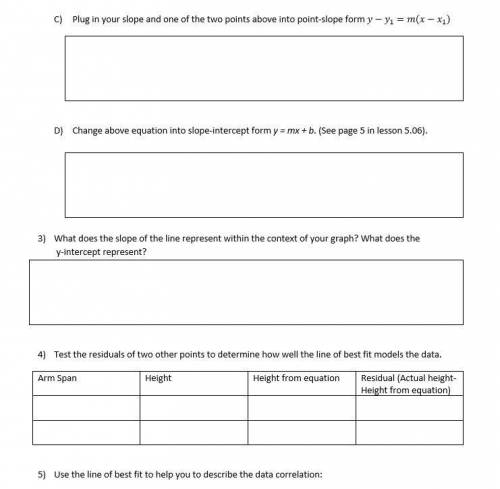
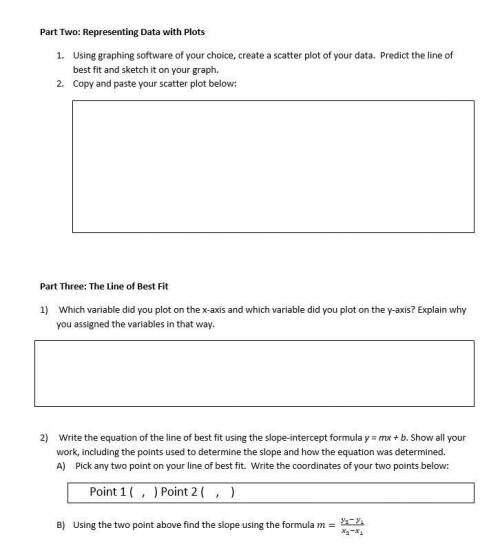
Part One: Measurements Measure your own height and arm span (from finger-tip to finger-tip) in inches. You will likely need some help from a parent, guardian, or sibling to get accurate measurements. Record your measurements on the “Data Record” document (bottom of this document). Use the “Data Record” to help you complete Part Two of this project. Measure 11 additional people and record their arm spans and height in inches. You may use the sample data provided in the table if you do not have 11 people to measure. Arm Span (inches) Height (inches) 58 60 49 47 51 55 19 25 37 39 44 45 47 49 36 35 41 40 46 50 58 61 Part Two: Representing Data with Plots Using graphing software of your choice, create a scatter plot of your data. Predict the line of best fit and sketch it on your graph. Copy and paste your scatter plot below: Part Three: The Line of Best Fit Which variable did you plot on the x-axis and which variable did you plot on the y-axis? Explain why you assigned the variables in that way. Write the equation of the line of best fit using the slope-intercept formula y = mx + b. Show all your work, including the points used to determine the slope and how the equation was determined. Pick any two point on your line of best fit. Write the coordinates of your two points below: Point 1 ( , ) Point 2 ( , ) Using the two point above find the slope using the formula m= (y_2- y_1)/(x_2-x_1 ) Plug in your slope and one of the two points above into point-slope form y-y_1=m(x-x_1) Change above equation into slope-intercept form y = mx + b. (See page 5 in lesson 5.06). What does the slope of the line represent within the context of your graph? What does the y-intercept represent? Test the residuals of two other points to determine how well the line of best fit models the data. Arm Span Height Height from equation Residual (Actual height-Height from equation) Use the line of best fit to help you to describe the data correlation: Using the line of best fit that you found in Part 3, Question 2, approximate how tall is a person whose arm span is 66 inches: According to your line of best fit, what is the arm span of a 74-inch-tall person: Data Record: Name Relationship to Student Arm Span in Inches Height in Inches

Answers: 3


Other questions on the subject: Mathematics
Mathematics, 21.06.2019 14:10, madlenserlipepu1o
What is the factored form of x2 − 4x − 5? (x + 5)(x − 1) (x + 5)(x + 1) (x − 5)(x − 1) (x − 5)(x + 1)
Answers: 2
Mathematics, 21.06.2019 15:40, aaliyahmaile13
Yo y do yall have 2 stars that means yall wrong bro
Answers: 1
Mathematics, 21.06.2019 21:10, sierravick123owr441
Given: lines a and b are parallel and line c is a transversal. prove: 2 is supplementary to 8 what is the missing reason in the proof? statement reason 1. a || b, is a transv 1. given 2. ∠6 ≅ ∠2 2. ? 3. m∠6 = m∠2 3. def. of congruent 4. ∠6 is supp. to ∠8 4. def. of linear pair 5. ∠2 is supp. to ∠8 5. congruent supplements theorem corresponding angles theorem alternate interior angles theorem vertical angles theorem alternate exterior angles theorem
Answers: 3
You know the right answer?
Part One: Measurements Measure your own height and arm span (from finger-tip to finger-tip) in inche...
Questions in other subjects:

Chemistry, 23.10.2019 03:00
Chemistry, 23.10.2019 03:00


Computers and Technology, 23.10.2019 03:00
Mathematics, 23.10.2019 03:00

History, 23.10.2019 03:00


