
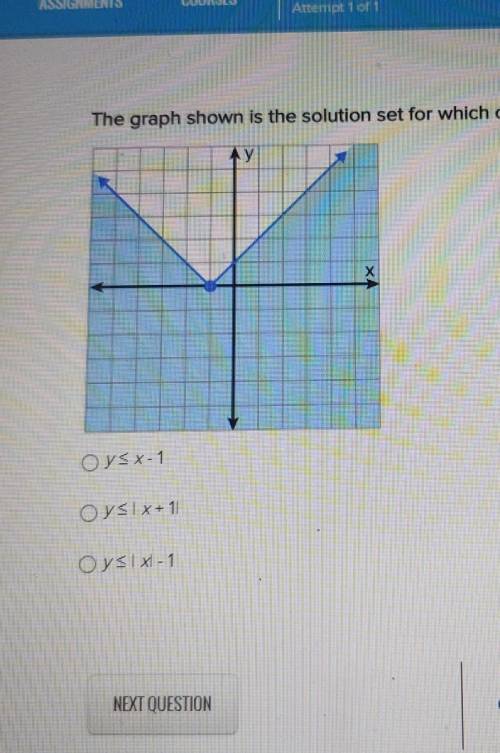
The graph shown is the solution set for which of the following inequalities?
O y < x -1
O y...

Mathematics, 25.07.2020 06:01 benjaminbooth10
The graph shown is the solution set for which of the following inequalities?
O y < x -1
O y<|x-1|
O y<|x|-1

Answers: 2


Other questions on the subject: Mathematics
Mathematics, 21.06.2019 18:00, cashhd1212
The given dot plot represents the average daily temperatures, in degrees fahrenheit, recorded in a town during the first 15 days of september. if the dot plot is converted to a box plot, the first quartile would be drawn at __ , and the third quartile would be drawn at __ link to graph: .
Answers: 1
Mathematics, 21.06.2019 18:30, alleahbethea199
Divide. write in the simplest form. 4 1/6 divided by 10
Answers: 2
Mathematics, 21.06.2019 19:00, babygirlmiller
The weight of an object in the water is 7% of its weight out of the water. what is the weight of a 652g object in the water?
Answers: 1
Mathematics, 21.06.2019 22:20, sethlynn2003
Question 5 of 10 2 points if a population is a sample of the population could be a. registered voters; all citizens o o b. baptists; all religious people o c. people who purchased shoes; all customers o d. the entire school faculty; math teachers
Answers: 3
You know the right answer?
Questions in other subjects:
Mathematics, 29.04.2021 01:00


History, 29.04.2021 01:00

Mathematics, 29.04.2021 01:00
Mathematics, 29.04.2021 01:00

Geography, 29.04.2021 01:00


