subject
Mathematics, 24.07.2020 14:01 clickbaitdxl

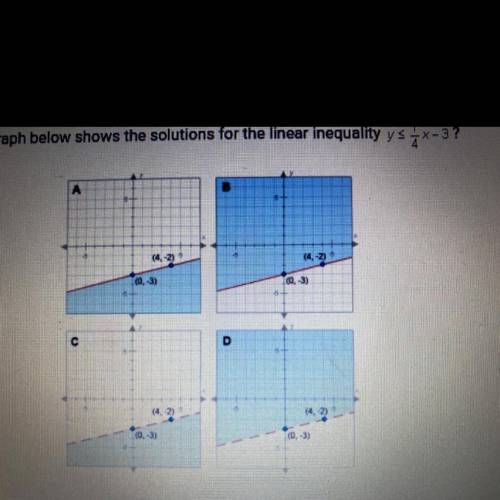
Which graph below shows the solutions for the linear inequality ys x-3? А
B
с
D
O A. Graph
O B. Graph B
O C. Graph D


Which graph below shows the solutions for the linear inequality ys x-3?

А
B
с
D
O A. Graph
O B. G

ansver
Answers: 3

Other questions on the subject: Mathematics

image
Mathematics, 21.06.2019 16:00, ringo12384
You eat 8 strawberries and your friend eats 12 strawberries from a bowl. there are 20 strawberries left. which equation and solution give the original number of strawberries?
Answers: 1
image
Mathematics, 21.06.2019 16:30, cxttiemsp021
Which approach to the theory-and-research cycle does the following sequence reflect: (1) specific observations suggest generalizations, (2) generalizations produce a tentative theory, (3) the theory is tested through the formation of hypotheses, and (4) hypotheses may provide suggestions for additional observations?
Answers: 1
image
Mathematics, 21.06.2019 19:50, ani61
Which function has the domain x> -11
Answers: 1
image
Mathematics, 21.06.2019 20:20, alinton06
How do the number line graphs of the solutions sets of -23 > x and x-23 differ?
Answers: 1