
Mathematics, 23.07.2020 02:01 amf14
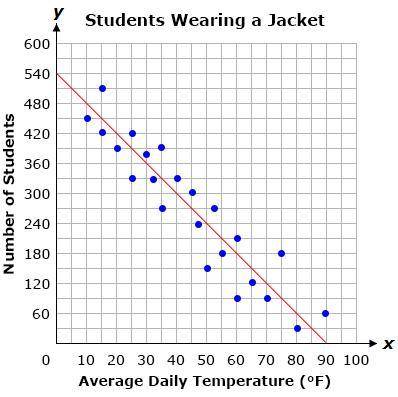
The graph below shows a line of best fit for data collected on the number of students who wear a jacket to school and the average daily temperature in degrees Fahrenheit.
Based on the line of best fit, how many students wear a jacket to school when the temperature is 50°F?
A.) 240
B.) 210
C.) 300
D.) 180

Answers: 3


Other questions on the subject: Mathematics
Mathematics, 21.06.2019 19:00, filthyfish
Teams of 4 are competing in a 1/4 mile relay race. each runner must run the same exact distance. what is the distance each teammate runs?
Answers: 1
Mathematics, 21.06.2019 22:00, Supermate11
The number of calories you burn depends on your weight. a 110-pound person burns 163 calories during 30 minutes of tennis. find the number of calories that a 190-pound person would burn during the same activity, assuming they burn calories at the same rate.
Answers: 1
Mathematics, 21.06.2019 22:30, coolcat3190
What is 1.5% of 120 or what number is 1.5% of 120
Answers: 2
Mathematics, 22.06.2019 00:30, PollyB1896
Which is an x-intercept of the graphed function? (0, 4) (–1, 0) (4, 0) (0, –1)
Answers: 2
You know the right answer?
The graph below shows a line of best fit for data collected on the number of students who wear a jac...
Questions in other subjects:


Social Studies, 04.08.2019 15:00
Mathematics, 04.08.2019 15:00
Social Studies, 04.08.2019 15:00

Chemistry, 04.08.2019 15:00

Biology, 04.08.2019 15:00


