
Mathematics, 23.07.2020 14:01 ashleyuchiha123
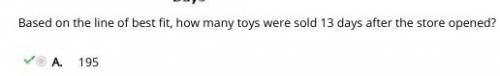
The graph below shows a line of best fit for data collected on the number of toys sold at a toy store since the opening of the store. Based on the line of best fit, how many toys were sold 13 days after the store opened?
A.) 195
B.) 260
C.) 325
D.) 130


Answers: 2


Other questions on the subject: Mathematics
Mathematics, 21.06.2019 18:00, thompsonmark0616
What is the value of x in the equation 2(x-4) = 4(2x + 1)?
Answers: 1
Mathematics, 21.06.2019 18:00, keidyhernandezm
List the sides of δrst in in ascending order (shortest to longest) if: a ∠r =x+28°, m∠s = 2x+16°, and m∠t = x+12°
Answers: 2
Mathematics, 21.06.2019 23:20, elizediax8683
Which expression is a factor of 12x2 + 29x – 8? x – 8 2x – 1 3x + 8 4x + 1
Answers: 1
You know the right answer?
The graph below shows a line of best fit for data collected on the number of toys sold at a toy stor...
Questions in other subjects:

Chemistry, 29.01.2021 20:10
Mathematics, 29.01.2021 20:10


History, 29.01.2021 20:10
Mathematics, 29.01.2021 20:10

Physics, 29.01.2021 20:10


