
Mathematics, 23.07.2020 22:01 ehsket
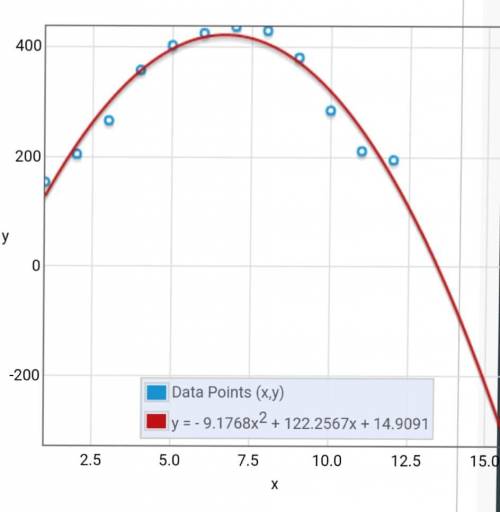
The table represents the average daily price of a two-bedroom beachfront condo each month, with January represented as month 1, February as month 2, and so on. Month (x) Daily Rental Price (y) 1 $154 2 $205 3 $266 4 $358 5 $403 6 $425 7 $437 8 $430 9 $381 10 $285 11 $211 12 $195 Use the graphing tool to determine the curve of best fit for this data. Write the equation of the curve in the space below.

Answers: 3


Other questions on the subject: Mathematics
Mathematics, 22.06.2019 00:30, JosefineRubino2204
Which of the following represents a function? 50 !
Answers: 1
Mathematics, 22.06.2019 04:40, sweetycakes6994
Experimental versus theoretical probability. someone me
Answers: 1
You know the right answer?
The table represents the average daily price of a two-bedroom beachfront condo each month, with Janu...
Questions in other subjects:


Mathematics, 05.03.2021 19:40


Geography, 05.03.2021 19:40
Mathematics, 05.03.2021 19:40


