
Mathematics, 22.07.2020 09:01 jakalenn2018
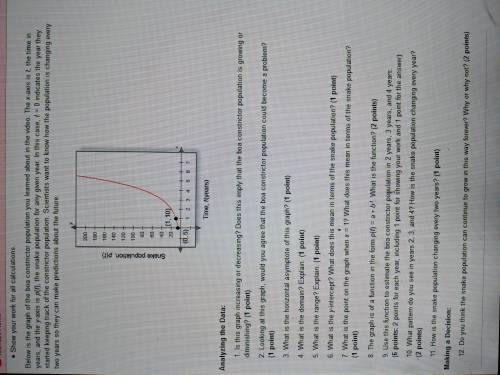
1. Is this graph increasing or decreasing? Does this imply that the boa constrictor population is growing or diminishing? (1 point) 2 Looking at this graph, would you agree that the boa constrictor population could become a problem? (1 point) 3. What is the horizontal asymptote of this graph? (1 point) 4. What is the domain? Explain. (1 point) 5. What is the range? Explain. (1 point) 6. What is the y-intercept? What does this mean in terms of the snake population? (1 point) 7 What is the point on the graph when x = 12 What does this mean in terms of the snake population? (1 point) 8. The graph is of a function in the form p(t) = a b What is the function? (2 points) 9. Use this function to estimate the boa constrictor population in 2 years, 3 years, and 4 years. (6 points: 2 points for each year, including 1 point for showing your work and 1 point for the answer) 10. What pattern do you see in years 2, 3, and 4? How is the snake population changing every year? (2 points) 11. How is the snake population changing every two years? (1 point) Making a Decision: 12. Do you think the snake population can continue to grow in this way forever? Why or why not? (2 points)

Answers: 3


Other questions on the subject: Mathematics
Mathematics, 21.06.2019 15:30, reagriffis24
What is the domain and range of each function 1. x (3, 5, 7, 8, 11) y ( 6, 7, 7, 9, 14) 2. x (-3, -1, 2, 5, 7) y (9, 5, 4, -5, -7)
Answers: 2
Mathematics, 21.06.2019 18:00, Tellyy8104
On a piece of paper, graph y< x+1. then determine which answer matches the graph you drew.
Answers: 2
You know the right answer?
1. Is this graph increasing or decreasing? Does this imply that the boa constrictor population is gr...
Questions in other subjects:
Mathematics, 12.07.2019 18:30

Mathematics, 12.07.2019 18:30

History, 12.07.2019 18:30

Biology, 12.07.2019 18:30


