
Mathematics, 23.07.2020 02:01 tvanek19
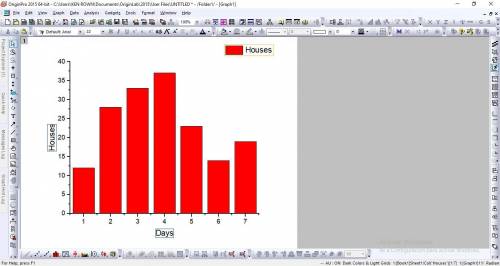
The following data points represent how many houses Gregg the Garbage Man visited each day last week.
12,28,33,37,23,14,9
use the data, and create a histogram

Answers: 2


Other questions on the subject: Mathematics
Mathematics, 21.06.2019 12:30, yashajanjan8550
What is the percent of increase for a population that changed from 438,000 to 561,000
Answers: 1
You know the right answer?
The following data points represent how many houses Gregg the Garbage Man visited each day last week...
Questions in other subjects:

Mathematics, 07.12.2020 21:00


Physics, 07.12.2020 21:00
English, 07.12.2020 21:00
Mathematics, 07.12.2020 21:00

Mathematics, 07.12.2020 21:00


