
Mathematics, 21.07.2020 08:01 danetth18
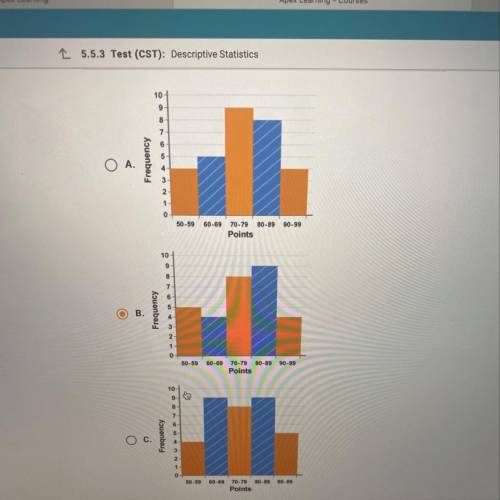
The frequency table shows the number of points scored during 30 Bulldogs
basketball games. On a piece of paper, draw a histogram to represent the
data. Then determine which answer choice matches the histogram you drew.
Points scored
Frequency
50 - 59
4
60 - 69
5
70 - 79
9
80 - 89
8
90 - 99
4
There is one more graph but I couldn’t fit it in the picture, if none of these seem right then it is probably that one.

Answers: 2


Other questions on the subject: Mathematics
Mathematics, 21.06.2019 22:30, mbalderp5bxjo
Solve for x. −3/4(x+2)=6 enter your answer in the box
Answers: 1
Mathematics, 21.06.2019 22:50, kaylarojascliff
On the first of each month sasha runs a 5k race she keeps track of her times to track her progress her time in minutes is recorded in the table
Answers: 1
Mathematics, 22.06.2019 01:30, roxygirl8914
Identify all the cases where non-probability sampling is used when attempting to study the characteristics of a large city. studies on every subject in the population divide a population in groups and obtain a sample studies with a limited amount of time demonstrate existing traits in a population studies with the nth person selected
Answers: 2
You know the right answer?
The frequency table shows the number of points scored during 30 Bulldogs
basketball games. On a pie...
Questions in other subjects:


Mathematics, 24.10.2019 07:43

History, 24.10.2019 07:43
Mathematics, 24.10.2019 07:43
Mathematics, 24.10.2019 07:43


