
Mathematics, 22.07.2020 01:01 mikey8510
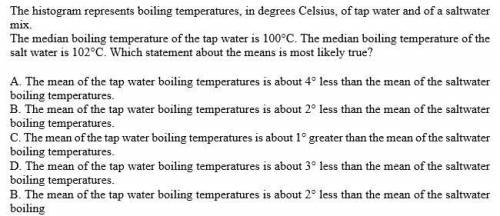
The histogram represents the distributions of boiling
temperatures, in degrees Celsius, of tap water and a
mixture of salt water.
Boiling Temperatures
10
9
8
7
6
Number
of
Trials
5
-Tap Water
Salt Water
4 3
N
1
0
98°C
99 C 100C 101 102 103 104°C
Temperature (°C)

Answers: 3


Other questions on the subject: Mathematics
Mathematics, 21.06.2019 19:00, kadams3836
The length of a rectangular piece of land is 92 yards more than three times its width. the perimeter is 760 yards. find its dimensions.
Answers: 1
Mathematics, 21.06.2019 21:10, ttrinityelyse17
The table below shows the approximate height of an object x seconds after the object was dropped. the function h(x)= -16x^2 +100 models the data in the table. for which value of x would this model make it the least sense to use? a. -2.75 b. 0.25 c. 1.75 d. 2.25
Answers: 2
You know the right answer?
The histogram represents the distributions of boiling
temperatures, in degrees Celsius, of tap wate...
Questions in other subjects:


