
Mathematics, 19.07.2020 19:01 KarateKat
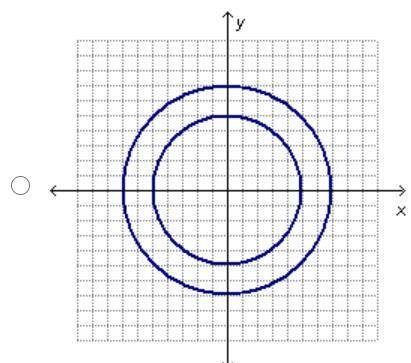
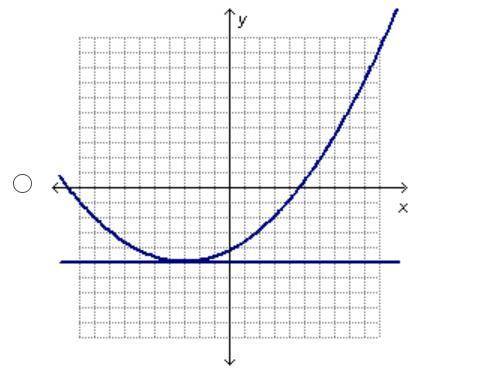
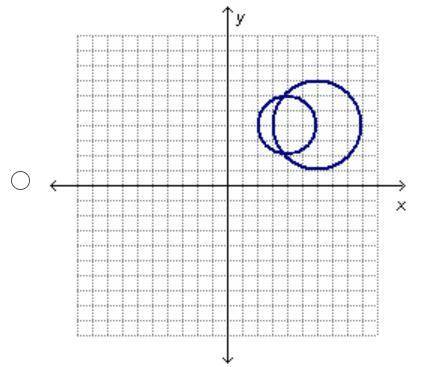
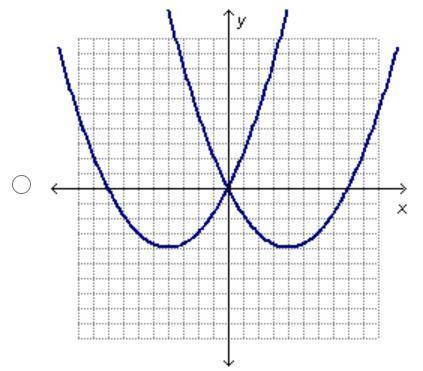
Which graph shows a system of equations with no solutions? On a coordinate plane, the graphs of 2 circles are shown. Both circles have a center at (0, 0). The smaller circle is within the larger circle and the smaller circle has a radius that is 2 units smaller than the larger circle. On a coordinate plane, a graph of a line and a parabola are shown. The line is horizontal to the x-axis at y = negative 5. The parabola opens up and its vertex on the line. On a coordinate plane, the graphs of 2 circles are shown. Both circles are in quadrant 1, and they intersect each other. On a coordinate plane, the graphs of 2 parabolas are shown. Both parabolas open up and they intersect each other at (0, 0). The first parabola has a vertex in quadrant 3 and the second parabola has a vertex in quadrant 4.

Answers: 1


Other questions on the subject: Mathematics
Mathematics, 21.06.2019 13:10, mountassarhajar2008
Identify whether the figure has plane symmetry, symmetry about an axis, or neither.
Answers: 1
Mathematics, 21.06.2019 22:00, iamsecond235p318rq
Find the greatest common factor of the followig monomials 46g^2h and 34g^6h^6
Answers: 1
Mathematics, 21.06.2019 22:00, blythephillips2734
Benjamin is making bow ties. how many 1/2yards lomg bow ties can he make if he has 18 feet of fabric?
Answers: 2
Mathematics, 21.06.2019 22:30, skylarjane1030
9.4.34 question to estimate the height of a stone figure, an observer holds a small square up to her eyes and walks backward from the figure. she stops when the bottom of the figure aligns with the bottom edge of the square, and when the top of the figure aligns with the top edge of the square. her eye level is 1.811.81 m from the ground. she is 3.703.70 m from the figure. what is the height of the figure to the nearest hundredth of a meter?
Answers: 1
You know the right answer?
Which graph shows a system of equations with no solutions? On a coordinate plane, the graphs of 2 ci...
Questions in other subjects:
Mathematics, 14.07.2019 23:30

History, 14.07.2019 23:30
History, 14.07.2019 23:30


Mathematics, 14.07.2019 23:30

Social Studies, 14.07.2019 23:30


