
Mathematics, 19.07.2020 01:01 wedderman8292
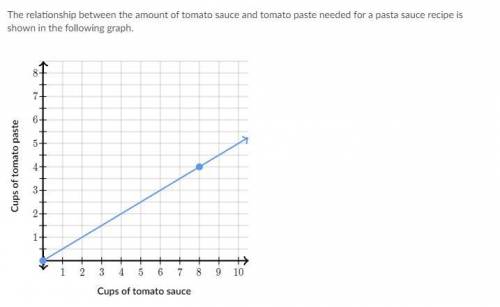
The relationship between the amount of tomato sauce and tomato paste needed for a pasta sauce recipe is shown in the following graph. which statement of the graph is true choose all answers that apply
a) the point (8,4) shows that 8 cups of tomato sauce are needed to serve 4 people
b) the recipe always requires the same amount of tomato paste as tomato sauce
c) none of the above
gl>:)

Answers: 3


Other questions on the subject: Mathematics
You know the right answer?
The relationship between the amount of tomato sauce and tomato paste needed for a pasta sauce recipe...
Questions in other subjects:
Mathematics, 04.03.2021 01:00

Chemistry, 04.03.2021 01:00

Mathematics, 04.03.2021 01:00
Chemistry, 04.03.2021 01:00


