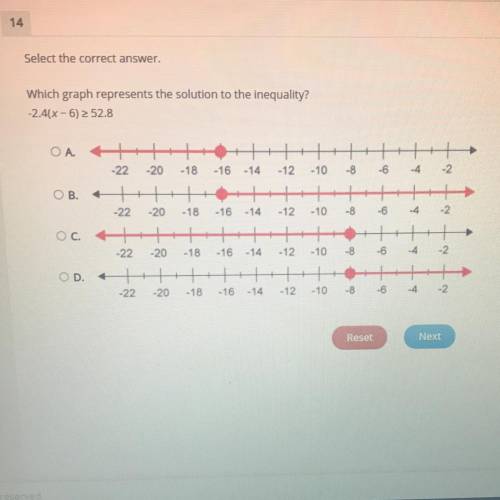
Which graph represents the solution to the inequality?
-2.4(x-6) > 52.8
...

Mathematics, 19.07.2020 01:01 jennainglish
Which graph represents the solution to the inequality?
-2.4(x-6) > 52.8

Answers: 3


Other questions on the subject: Mathematics
Mathematics, 21.06.2019 17:30, ahnagoede2768
Thelime contains the point(-3,0) and parallel x-3y=3( show all work)
Answers: 3
Mathematics, 21.06.2019 19:00, katherinemartinez173
Simplify. −4x^2 (5x^4−3x^2+x−2) −20x^6−12x^4+8x^3−8x^2 −20x^6+12x^4−4x^3+8x^2 −20x^8+12x^4−4x^2+8x −20x^6+12x^4+4x^3−8x^2
Answers: 1
You know the right answer?
Questions in other subjects:
Mathematics, 08.11.2021 08:50
Mathematics, 08.11.2021 08:50

History, 08.11.2021 08:50

Arts, 08.11.2021 08:50
Mathematics, 08.11.2021 08:50

Chemistry, 08.11.2021 08:50

English, 08.11.2021 08:50
Mathematics, 08.11.2021 08:50


