
Mathematics, 18.07.2020 01:01 bikerhomie
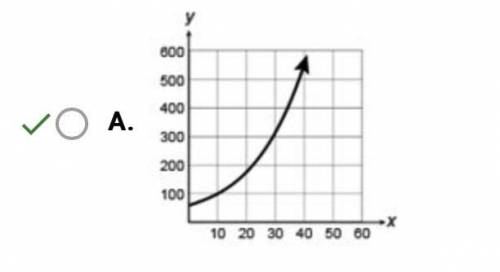
A herd of bison currently has 55 members. Based on the available resources,
biologists estimate that the size of the herd will increase at a rate of 6% per
year. Which of the following graphs models this relationship, if the x-axis
represents years and the y-axis represents number of bison?

Answers: 2


Other questions on the subject: Mathematics
Mathematics, 21.06.2019 21:30, kassandramarie16
Noel is hoping to make a profit (in $) on the school play and has determined the function describing the profit to be f(t) = 8t – 2654, where t is the number of tickets sold. what does the number 8 tell you?
Answers: 1
Mathematics, 21.06.2019 22:30, izabelllreyes
Gabrielle's age is two times mikhail's age. the sum of their ages is 84. what is mikhail's age?
Answers: 2
Mathematics, 21.06.2019 23:30, cornpops1749
Graph the line with the given slope m and y-intercept b. m=-3,b=1
Answers: 1
You know the right answer?
A herd of bison currently has 55 members. Based on the available resources,
biologists estimate tha...
Questions in other subjects:


