Mathematics, 18.07.2020 06:01 amylumey2005
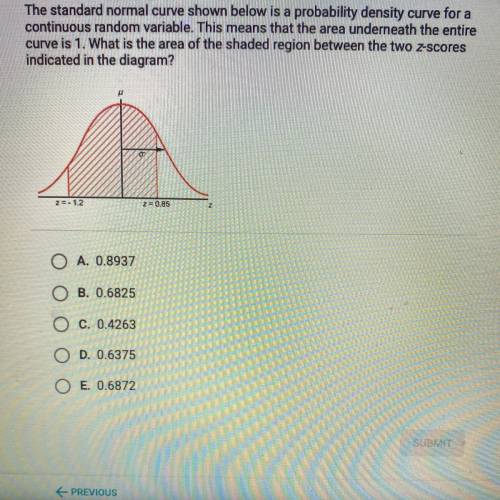
The standard normal curve shown below is a probability density curve for a
continuous random variable. This means that the area underneath the entire
curve is 1. What is the area of the shaded region between the two z-scores
indicated in the diagram? z=-1.2 z=0.85
A.0.8937
B.0.6825
C.0.4263
D.0.6375
E.0.6872


Answers: 3


Other questions on the subject: Mathematics


Mathematics, 21.06.2019 19:40, Suzispangler2264
What happens to the area as the sliders are adjusted? what do you think the formula for the area of a triangle is divided by 2?
Answers: 1

You know the right answer?
The standard normal curve shown below is a probability density curve for a
continuous random variab...
Questions in other subjects:


Mathematics, 24.03.2021 14:00


Mathematics, 24.03.2021 14:00

Mathematics, 24.03.2021 14:00

Mathematics, 24.03.2021 14:00

Social Studies, 24.03.2021 14:00


History, 24.03.2021 14:00

Mathematics, 24.03.2021 14:00


