
Mathematics, 17.07.2020 19:01 noor66
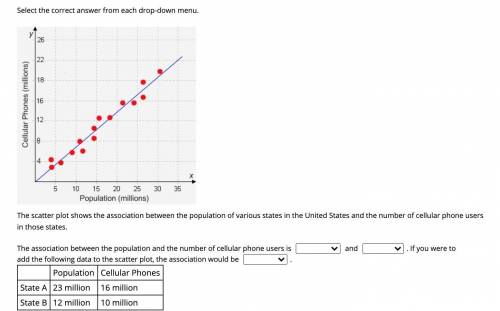
The scatter plot shows the association between the population of various states in the United States and the number of cellular phone users in those states. Answer Choices 1. Strong/ Weak/ Moderate 2. Positive/ Negitive 3. Strong/ Weak/ the same

Answers: 2


Other questions on the subject: Mathematics
Mathematics, 21.06.2019 17:00, sophiawatson70
Line gh passes through points (2, 5) and (6, 9). which equation represents line gh? y = x + 3 y = x – 3 y = 3x + 3 y = 3x – 3
Answers: 1
Mathematics, 21.06.2019 17:20, ryleepretty
Two language majors, anna and megan, took exams in two languages. anna scored 85 on both exams. megan scored 74 on the first exam and 85 on the second exam. overall, student scores on the first exam had a mean of 82 and a standard deviation of 4, and the second exam scores had a mean of 71 and a standard deviation of 13. a) to qualify for language honors, a major must maintain at least an 85 average across all language courses taken. so far, which of anna and megan qualify? b) which student's overall performance was better?
Answers: 2
Mathematics, 21.06.2019 19:00, Patricia2121
Me with geometry ! in this figure, bc is a perpendicular bisects of kj. dm is the angle bisects of bdj. what is the measure of bdm? •60° •90° •30° •45°
Answers: 2
You know the right answer?
The scatter plot shows the association between the population of various states in the United States...
Questions in other subjects:


