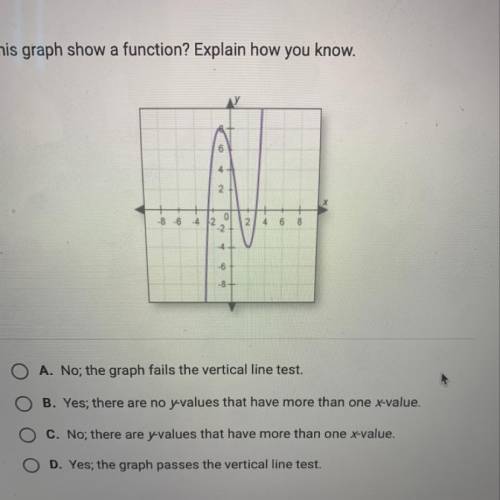
Does this graph show a function? Explain how you know.
4
2
86
4
0
-2<...

Mathematics, 17.07.2020 02:01 shealene7
Does this graph show a function? Explain how you know.
4
2
86
4
0
-2
2
4
6
8
4
6
-8
A. No; the graph fails the vertical line test.
B. Yes; there are no y-values that have more than one x-value.
C. No; there are y values that have more than one x-value.
Ο Ο
D. Yes; the graph passes the vertical line test.

Answers: 1


Other questions on the subject: Mathematics
Mathematics, 21.06.2019 17:10, ivilkas23
The frequency table shows a set of data collected by a doctor for adult patients who were diagnosed with a strain of influenza. patients with influenza age range number of sick patients 25 to 29 30 to 34 35 to 39 40 to 45 which dot plot could represent the same data as the frequency table? patients with flu
Answers: 2
Mathematics, 21.06.2019 20:30, donnafranks2003
If g^-1(x) is the inverse of g (x) which statement must be true
Answers: 3
Mathematics, 21.06.2019 20:40, mruffier6239
In a 45-45-90 right triangle, what is the ratio of the length of one leg to the length of the other leg? а . 1: 2 в. 2: 1 с. 2: 1 d. 1: 1
Answers: 1
You know the right answer?
Questions in other subjects:

Mathematics, 10.05.2021 19:00

Physics, 10.05.2021 19:10
Mathematics, 10.05.2021 19:10
Mathematics, 10.05.2021 19:10
Mathematics, 10.05.2021 19:10
Mathematics, 10.05.2021 19:10
Mathematics, 10.05.2021 19:10
Mathematics, 10.05.2021 19:10


