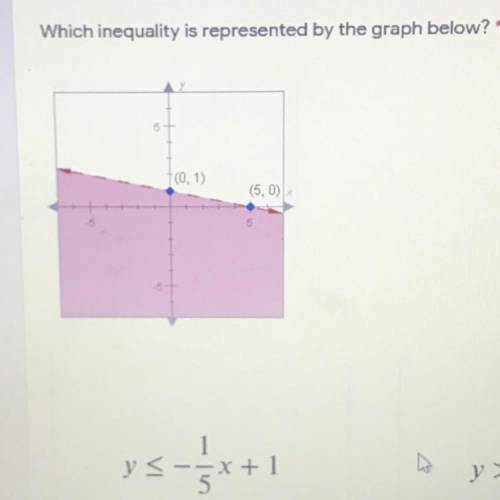
Which inequality is represented by the graph below?
...

Mathematics, 15.07.2020 19:01 josuemartinez1030
Which inequality is represented by the graph below?

Answers: 3


Other questions on the subject: Mathematics
Mathematics, 21.06.2019 17:00, sophiawatson70
Line gh passes through points (2, 5) and (6, 9). which equation represents line gh? y = x + 3 y = x – 3 y = 3x + 3 y = 3x – 3
Answers: 1
Mathematics, 21.06.2019 19:40, Candieboo4006
It appears that people who are mildly obese are less active than leaner people. one study looked at the average number of minutes per day that people spend standing or walking. among mildly obese people, the mean number of minutes of daily activity (standing or walking) is approximately normally distributed with mean 376 minutes and standard deviation 64 minutes. the mean number of minutes of daily activity for lean people is approximately normally distributed with mean 528 minutes and standard deviation 107 minutes. a researcher records the minutes of activity for an srs of 7 mildly obese people and an srs of 7 lean people. use z-scores rounded to two decimal places to answer the following: what is the probability (image for it appears that people who are mildly obese are less active than leaner people. one study looked at the averag0.0001) that the mean number of minutes of daily activity of the 6 mildly obese people exceeds 420 minutes? what is the probability (image for it appears that people who are mildly obese are less active than leaner people. one study looked at the averag0.0001) that the mean number of minutes of daily activity of the 6 lean people exceeds 420 minutes?
Answers: 1
Mathematics, 21.06.2019 20:00, allycoops666666
Sarah took the advertising department from her company on a round trip to meet with a potential client. including sarah a total of 11 people took the trip. she was able to purchase coach tickets for $280 and first class tickets for $1280. she used her total budget for airfare for the trip, which was $6080. how many first class tickets did she buy? how many coach tickets did she buy?
Answers: 1
You know the right answer?
Questions in other subjects:


English, 30.12.2019 17:31
Biology, 30.12.2019 18:31


