
Mathematics, 14.07.2020 17:01 jettskii214
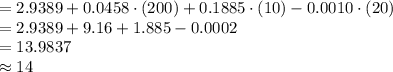
Now that we have our linear regression model, let’s try to make a prediction for the sales given a new set of advertising budgets as follows: new. dat <- data. frame(TV=200, Radio=10, Newspaper=20) You are required to report the predicted sales as well as the lower and upper bound for the 95% prediction interval. What will you report?

Answers: 1


Other questions on the subject: Mathematics
Mathematics, 21.06.2019 18:30, avahrhey24
Sketch one cycle if the cosine function y=2cos2theta
Answers: 1
Mathematics, 21.06.2019 22:00, lokiliddel
In dire need~! describe how to use area models to find the quotient 2/3 divided by 1/5. check your work by also finding the quotient 2/3 divided by 1/5 using numerical operations only.
Answers: 3
Mathematics, 22.06.2019 01:30, mariaguadalupeduranc
In 2000, for a certain region, 27.1% of incoming college freshman characterized their political views as liberal, 23.1% as moderate, and 49.8% as conservative. for this year, a random sample of 400 incoming college freshman yielded the frequency distribution for political views shown below. a. determine the mode of the data. b. decide whether it would be appropriate to use either the mean or the median as a measure of center. explain your answer. political view frequency liberal 118 moderate 98 conservative 184 a. choose the correct answer below. select all that apply. a. the mode is moderate. b. the mode is liberal. c. the mode is conservative. d. there is no mode.
Answers: 1
You know the right answer?
Now that we have our linear regression model, let’s try to make a prediction for the sales given a n...
Questions in other subjects:
Mathematics, 14.11.2019 04:31

Geography, 14.11.2019 04:31

History, 14.11.2019 04:31

Chemistry, 14.11.2019 04:31

Advanced Placement (AP), 14.11.2019 04:31


