A
Step-by-step explanation:
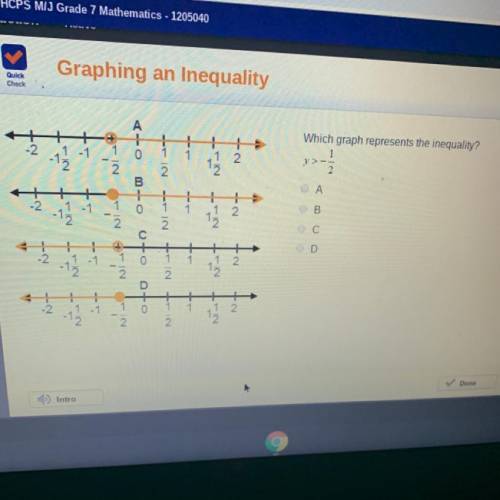
Given the equality y > -½, it means the values of y is greater than -½.
The values of y would range from 0 upwards. I.e. 0, ½, 1, 1½, 2. . .
Thus, when graphed on a number line, the circle that appears like "o" would start from -½, and the "o" would not be full or shaded to indicate that -½ is not included in the values of y, which are greater than -½. Since the values of y are greater than -½ the direction of the arrow that indicates values of y would point towards our far right, to indicate the values included as y.
Therefore, the graph that indicates the inequality y > ½ is A