
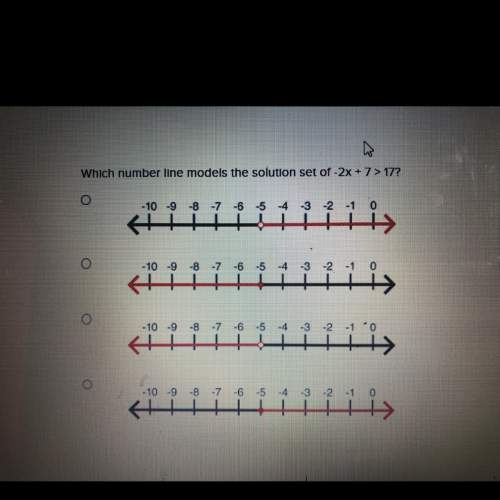
Mathematics, 15.07.2020 02:01 quigley523
As a scientist, you study 200 grams of a radioactive material for seven months, and suppose you have obtained the following data:
Month Weight
0 500
2 329
4 216.1
6 142
8 93
10 61.29
12 40.3
1. Using a graphing utility or Excel, build an exponential model from the data.
2. Using a graphing utility, build an exponential model from the data.
3. Express the weight as the function of months.
4. Graph the exponential function in the scatter diagram.
5. Interpret the constant parameters of this function.
6. Determine the half-life of the radioactive material.
7. How much radioactive material will be left after 30 months?
8. When will you have 40 grams of this radioactive material?

Answers: 3


Other questions on the subject: Mathematics
Mathematics, 21.06.2019 13:00, Ancelingabaut
How can we find the measure of an exterior angle if we know the measurement of an interior angle
Answers: 2
Mathematics, 21.06.2019 14:00, angellv917
At the many chips cookie company they are serious about the number of chocolate chips in their cookies they claim that each cookie hasn't c chips. if their claim is true there will be 200 chips in 10 cookies
Answers: 2
Mathematics, 21.06.2019 22:30, patrickfryer240
When i'm with my factor 5, my prodect is 20 .when i'm with my addend 6' my sum is 10.what number am i
Answers: 1
Mathematics, 22.06.2019 01:30, heidiallen565
Arace is 10 kilometers long. markers will be placed at the beginning and end of the race course and at each 500 meter mark. how many markers are needed to mark the course for the race?
Answers: 3
You know the right answer?
As a scientist, you study 200 grams of a radioactive material for seven months, and suppose you have...
Questions in other subjects:

Chemistry, 19.08.2021 09:20
Mathematics, 19.08.2021 09:20


History, 19.08.2021 09:20

Social Studies, 19.08.2021 09:20
Mathematics, 19.08.2021 09:20


