
Mathematics, 15.07.2020 01:01 Tanya120
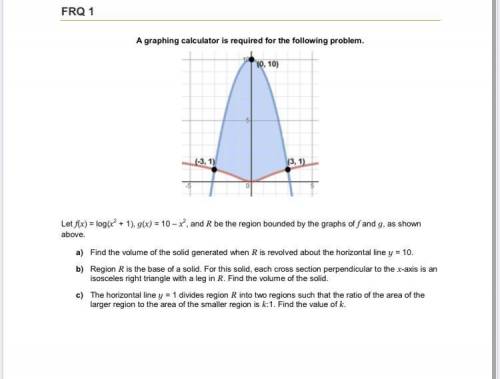
Letf(x)=log(x^2+1),g(x)=10-x^2 and R be the region bounded by the graphs of f and g, as shown above. a) Find the volume of the solid generated when R is revolved about the horizontal line y = 10. b) Region R is the base of a solid. For this solid, each cross section perpendicular to the x-axis is an isosceles right triangle with a leg in R. Find the volume of the solid. c) The horizontal line y = 1 divides region R into two regions such that the ratio of the area of the larger region to the area of the smaller region is k:1. Find the value of k.

Answers: 1


Other questions on the subject: Mathematics
Mathematics, 22.06.2019 01:20, lauretta
Aprobability experiment is conducted in which the sample space of the experiment is s={7,8,9,10,11,12,13,14,15,16,17,18 }, event f={7,8,9,10,11,12}, and event g={11,12,13,14}. assume that each outcome is equally likely. list the outcomes in f or g. find p(f or g) by counting the number of outcomes in f or g. determine p(f or g) using the general addition rule.
Answers: 2
Mathematics, 22.06.2019 01:30, aprilreneeclaroxob0c
The winner of a golf tournament made five putts for birdies. the lengths of these putts are in the table shown. what is the total distance of the putts in the yards, feet, and inches?
Answers: 1
Mathematics, 22.06.2019 02:00, whathelppp
Pleasseee important quick note: enter your answer and show all the steps that you use to solve this problem in the space provided. use the circle graph shown below to answer the question. a pie chart labeled favorite sports to watch is divided into three portions. football represents 42 percent, baseball represents 33 percent, and soccer represents 25 percent. if 210 people said football was their favorite sport to watch, how many people were surveyed?
Answers: 1
You know the right answer?
Letf(x)=log(x^2+1),g(x)=10-x^2 and R be the region bounded by the graphs of f and g, as shown above....
Questions in other subjects:

Mathematics, 10.03.2021 20:00


Arts, 10.03.2021 20:00

Mathematics, 10.03.2021 20:00


