
Mathematics, 14.07.2020 18:01 JvGaming2001
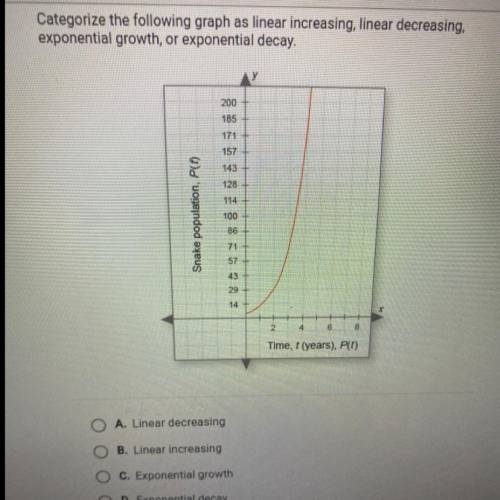
Categorize the following graph as linear increasing, linear decreasing,
exponential growth, or exponential decay.
200
185
171
Snake population, P()
157
143
128
114
100
86
71
57
43
29
14
8
Time, 1 (years), P(1)

Answers: 2


Other questions on the subject: Mathematics
Mathematics, 21.06.2019 17:40, cifjdhhfdu
Aregular hexagon has sides of 2 feet. what is the area of the hexagon? 12 ft2 12 ft2 24 ft2 6 ft2
Answers: 2
Mathematics, 21.06.2019 20:20, oofoofoof1
Sample response: if the graph passes the horizontaline test, then the function is one to one. functions that are one to one have inverses that a therefore, the inverse is a hinction compare your response to the sample response above. what did you include in your explanation? a reference to the horizontal-line test d a statement that the function is one-to-one the conclusion that the inverse is a function done
Answers: 2
Mathematics, 21.06.2019 23:00, BeautyxQueen
Who long does it take to drive 150 miles at 45 miles per hour
Answers: 2
Mathematics, 22.06.2019 04:30, Geo777
Determine whether the data described are qualitative or quantitative and give their level of measurement if the data are quantitative, state whether they are continuous or discrete. soft drink sizes: small, medium, large. oa. qualitative, nominal o b. qualitative, ordinal- o c. quantitative, ordinal, discrete o d. quantitative, ordinal
Answers: 3
You know the right answer?
Categorize the following graph as linear increasing, linear decreasing,
exponential growth, or expo...
Questions in other subjects:


Business, 19.09.2021 14:00
Mathematics, 19.09.2021 14:00

Social Studies, 19.09.2021 14:00
Mathematics, 19.09.2021 14:00
Mathematics, 19.09.2021 14:00

History, 19.09.2021 14:00


