
Mathematics, 08.07.2020 09:01 gingerham1
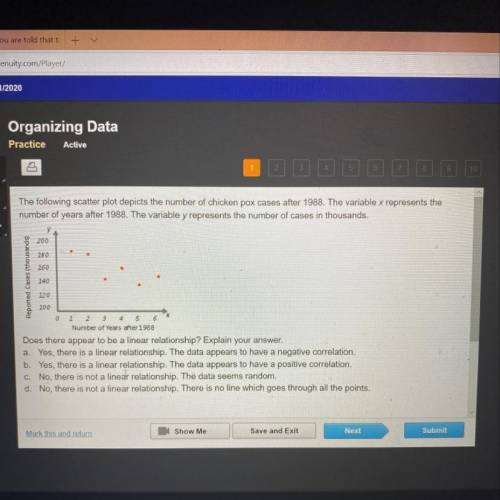
The following scatter plot depicts the number of chicken pox cases after 1988. The variable x represents the
number of years after 1988. The variable y represents the number of cases in thousands.
200
280
260
Reported Cases (thousands)
140
220
4
200
0 2 2 3 5 6
Number of years after 1988
Does there appear to be a linear relationship? Explain your answer.
a. Yes, there is a linear relationship. The data appears to have a negative correlation.
b. Yes, there is a linear relationship. The data appears to have a positive correlation.
C. No, there is not a linear relationship. The data seems random.
d. No, there is not a linear relationship. There is no line which goes through all the points.

Answers: 1


Other questions on the subject: Mathematics
Mathematics, 21.06.2019 22:00, bobk1433
Mrs. avila is buying a wallpaper border to go on all of her kitchen walls. she wants to buy 5 extra feet of wallpaper border than she needs to be sure she has enough. she buys 55.5 feet of the border. the store owner selling the border uses the width of mrs. avila's kitchen to determine that the length of her kitchen must be 14.5 feet.
Answers: 2
Mathematics, 21.06.2019 23:10, izzynikkie
Which graph represents the linear function below? y-4= (4/3)(x-2)
Answers: 2
You know the right answer?
The following scatter plot depicts the number of chicken pox cases after 1988. The variable x repres...
Questions in other subjects:

Mathematics, 04.07.2019 18:00

English, 04.07.2019 18:00

Mathematics, 04.07.2019 18:00


History, 04.07.2019 18:00


