Mathematics, 07.07.2020 02:01 mia13290
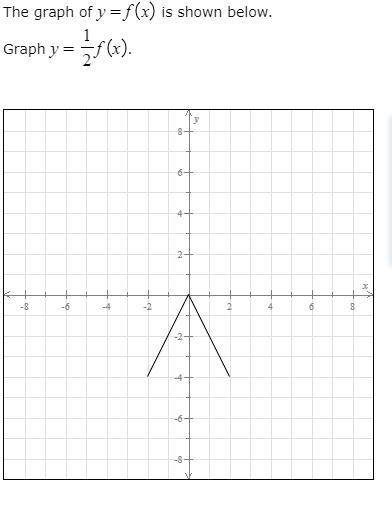
How would I graph this? Would I graph it on top of the other graph given? I have figured out: when x is 1 y is -2 when x is 2 y is -4 when x is -1 y is -2 when x is -2 y is -4


Answers: 1


Other questions on the subject: Mathematics

Mathematics, 21.06.2019 15:30, LadyHolmes67
When i add money am i supposed to make it like this 7+12 or 7.00+12.00 because i got 19 dollars for my answer
Answers: 2


Mathematics, 21.06.2019 21:00, jonquil201
These box plots show the number of electoral votes one by democratic and republican presidential candidates for the elections from 1984 through 2012. which statement best compares the spread of the data sets
Answers: 2

Mathematics, 21.06.2019 22:30, monkemily1
There are 93 calories in a small candy bar how many calories are ther in a half dozen small candy bars?
Answers: 2
You know the right answer?
How would I graph this? Would I graph it on top of the other graph given? I have figured out: when x...
Questions in other subjects:


English, 26.03.2020 05:25


