
Mathematics, 08.07.2020 01:01 dominickstrickland
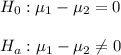
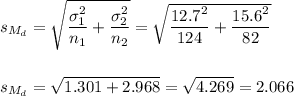
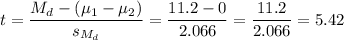
The U. S. Center for Disease Control reports that the mean life expectancy was 47.6 years for whites born in 1900 and 33.0 years for nonwhites. Suppose that you randomly survey death records for people born in 1900 in a certain county. Of the 124 whites, the mean life span was 45.3 years with a standard deviation of 12.7 years. Of the 82 nonwhites, the mean life span was 34.1 years with a standard deviation of 15.6 years.
Required:
a. Conduct a hypothesis test to see if the mean life spans in the county were the same for whites and nonwhites.
b. State the null and alternative hypotheses.
c. Which distribution (normal or Student's t) would you use for this hypothesis test?
d. Calculate the test statistic and p-value.
e. Does it appear that the means are the same? Why or why not?

Answers: 1


Other questions on the subject: Mathematics
Mathematics, 21.06.2019 18:30, allenlog000
Can someone me out here and the tell me the greatest common factor
Answers: 1
Mathematics, 21.06.2019 19:00, ALEXMASTERS64
Moira has a canvas that is 8 inches by 10 inches. she wants to paint a line diagonally from the top left corner to the bottom right corner. approximately how long will the diagonal line be?
Answers: 1
Mathematics, 22.06.2019 04:00, jaylynomalley
In a fruit survey, 300 children choose their favorite fruit out of apples, bananas, and watermelon. 150 chose apples and 90 chose bananas. what percent chose watermelon?
Answers: 1
You know the right answer?
The U. S. Center for Disease Control reports that the mean life expectancy was 47.6 years for whites...
Questions in other subjects:


