
Mathematics, 07.07.2020 21:01 cvvalle15
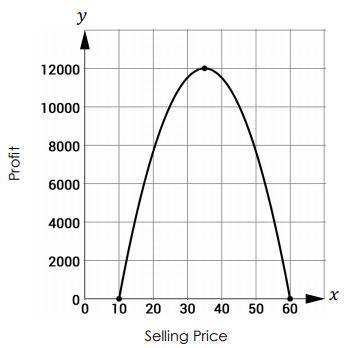
Anthony owns a sporting goods store. During his first year in the business, he collected data on different prices that yielded different profits for baseball gloves. He used the data to create the following graph showing the relationship between the selling price of an item and the profit he earned for its sale. List the key parts of this graph, and explain what each part means in a real-world context.

Answers: 3


Other questions on the subject: Mathematics
Mathematics, 21.06.2019 15:00, awkwardness92
You put the following items into your rucksack. ham 600 g cheese 380 g tomatoes 270 g how much do all the ingredients weigh in total?
Answers: 1
Mathematics, 21.06.2019 16:00, juniorvaldez60
What are the related frequencies to the nearest hundredth of the columns of the two way table? group 1: a-102 b-34group 2: a-18 b-14edited: i don’t have all day to be waiting for an answer. i figured it out.
Answers: 2
Mathematics, 22.06.2019 00:50, richard80
Match the following reasons with the statements given to create the proof. 1. do = ob, ao = oc sas 2. doc = aob given 3. triangle cod congruent to triangle aob vertical angles are equal. 4. 1 = 2, ab = dc if two sides = and ||, then a parallelogram. 5. ab||dc if alternate interior angles =, then lines parallel. 6. abcd is a parallelogram cpcte
Answers: 3
You know the right answer?
Anthony owns a sporting goods store. During his first year in the business, he collected data on dif...
Questions in other subjects:
Mathematics, 28.09.2021 19:10

Mathematics, 28.09.2021 19:10
Mathematics, 28.09.2021 19:10

Mathematics, 28.09.2021 19:10

Chemistry, 28.09.2021 19:10

Advanced Placement (AP), 28.09.2021 19:10


