
Mathematics, 07.07.2020 19:01 Squara
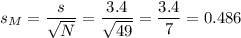
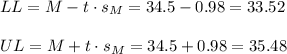
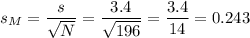
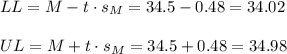
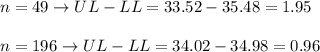
The mean and standard deviation of a random sample of n measurements are equal to 34.5 and 3.4, respectively. A. Find a 95 % confidence interval for μ if n=49.B. Find a 95% confidence interval for μ if n=196.C. Find the widths of the confidence intervals found in parts a and b. D. What is the effect on the width of a confidence interval of quadrupling the sample size while holding the confidence coefficient fixed?1. Quadrupling the sample size while holding the confidence coefficient fixed decreases the width of the confidence interval by a factor of 4.2. Quadrupling the sample size while holding the confidence coefficient fixed increases the width of the confidence interval by a factor of 2.3. Quadrupling the sample size while holding the confidence coefficient fixed increases the width of the on confidence interval by a factor of 4.4. Quadrupling the sample size while holding the confidence coefficient fixed does not affect the width of the confidence interval.5. Quadrupling the sample size while holding the confidence coefficient fixed decreases the width of the confidence interval by a factor of 2.

Answers: 2


Other questions on the subject: Mathematics
Mathematics, 21.06.2019 22:10, BreadOfTheBear
Use the spider tool located on page 1 of this activity to draw a 12-pointed star for the new logo. (hint: if the spider rotates 360 degrees -- or 720 degrees or 1080 degrees -- she will be facing in the same direction in which she started. when the spider is done drawing, you want her to be facing in the same direction in which she started. she'll be making 12 rotations, all the same size, so each rotation must be some multiple of 360/12 = 30 degrees.) urgently. been stuck on this problem for around 45 minutes now.! it should be easy if you're smart enough
Answers: 3
Mathematics, 22.06.2019 01:30, kadinmorgan
Acell phone company offers two plans to its subscribers. at the time new subscribers sign up, they are asked to provide some demographic information. the mean yearly income for a sample of 40 subscribers to plan a is $45,000 with a standard deviation of $9,200. for a sample of 25 subscribers to plan b, the mean income is $64,300 with a standard deviation of $7,100. at the 0.025 significance level, is it reasonable to conclude the mean income of those selecting plan b is larger? assume unequal population standard deviations. hint: for the calculations, assume the plan a as the first sample. what is the decision rule? (negative amount should be indicated by a minus sign. round your answer to 3 decimal places.) compute the value of the test statistic. (negative amount should be indicated by a minus sign. round your answer to 2 decimal places.) what is your decision regarding h0 ? reject h0 fail to reject h0 compute the p-value. less than 0.01 between 0.01 and 0.025 between 0.025 and 0.05 between 0.05 and 0.10 greater than 0.10
Answers: 3
You know the right answer?
The mean and standard deviation of a random sample of n measurements are equal to 34.5 and 3.4, resp...
Questions in other subjects:

History, 22.06.2019 17:30

Biology, 22.06.2019 17:30

Mathematics, 22.06.2019 17:30
Mathematics, 22.06.2019 17:30
Mathematics, 22.06.2019 17:30
Mathematics, 22.06.2019 17:30
History, 22.06.2019 17:30


