
Mathematics, 06.07.2020 21:01 babyskitt
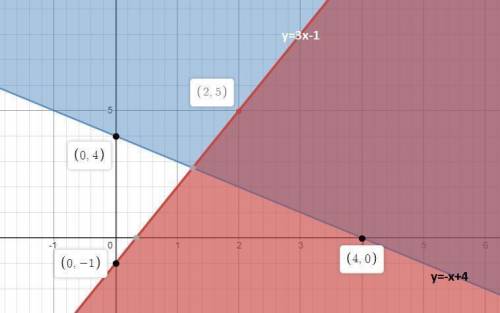
(04.06 MC) In the graph, the area below f(x) is shaded and labeled A, the area below g(x) is shaded and labeled B, and the area where f(x) and g(x) have shading in common is labeled AB. Graph of two intersecting lines. One line f of x is solid and goes through the points 0, 4, and 4, 0 and is shaded above the line. The other line g of x is solid, and goes through the points 0, negative 1 and 2, 5 and is shaded in below the line. The graph represents which system of inequalities? y ≤ −3x − 1 y ≤ −x − 4 y ≥ −3x + 1 y ≤ −x − 4 y ≤ 3x − 1 y ≤ −x + 4 y ≤ 3x − 1 y ≥ −x + 4

Answers: 2


Other questions on the subject: Mathematics
Mathematics, 21.06.2019 18:00, amandaclark255
Last year, a state university received 3,560 applications from boys. of those applications, 35 percent were from boys who lived in other states. part a)how many applications did the university receive from boys who lived in other states? part b)applications to the university from boys represented 40percent of all applications. how many applications did the university receive in all? i don't how to do part b so me and plz tell how you got your answer
Answers: 1
Mathematics, 21.06.2019 23:50, stricklandashley43
Quick graph the line for y+2=32(x+4) on the coordinate plane. does anyone know the cordinates will mark brainliest.
Answers: 1
Mathematics, 22.06.2019 00:40, townselt3861
‼️‼️‼️‼️‼️the pressure exerted on the walls of a container by a gas enclosed within it is directly proportional to the temperature of the gas. if the pressure is 6 pounds per square inch when the temperature is 440 f, find the pressure exerted when the temperature of the gas is 380°f. (show work)
Answers: 1
Mathematics, 22.06.2019 01:30, zitterkoph
The box plots show the distributions of the numbers of words per line in an essay printed in two different fonts.which measure of center would be best to compare the data sets? the median is the best measure because both distributions are left-skewed.the mean is the best measure because both distributions are left-skewed.the median is the best measure because both distributions are symmetric.the mean is the best measure because both distributions are symmetric
Answers: 1
You know the right answer?
(04.06 MC) In the graph, the area below f(x) is shaded and labeled A, the area below g(x) is shaded...
Questions in other subjects:


Biology, 15.12.2021 19:00


