
Mathematics, 06.07.2020 14:01 hannahkharel2
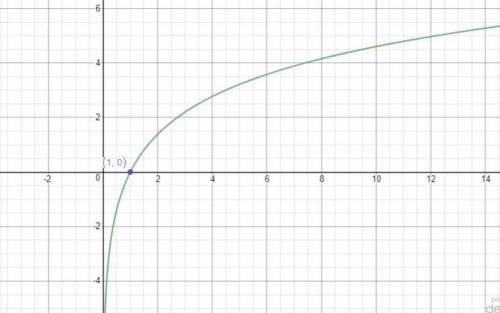
Which of the following shows the graph of y = 2 l n x On a coordinate plane, a curve starts at (0, negative 2) in quadrant 4 and then increases into quadrant 1 and approaches y = 3. On a coordinate plane, a curve starts in quadrant 4 and then curves up into quadrant 1 and approaches y = 5. It crosses the x-axis at (1, 0). On a coordinate plane, a curve approaches the y-axis in quadrant 2 and then increases into quadrant 1. It crosses the y-axis at (0, 1). On a coordinate plane, a curve approaches the y-axis in quadrant 2 and then increases into quadrant 1. It crosses the y-axis at (0, 2).

Answers: 1


Other questions on the subject: Mathematics
Mathematics, 21.06.2019 15:30, xxxamslashxxx9
Data was collected on myrtle beach for 11 consecutive days. each day the temperature and number of visitors was noted. the scatter plot below represents this data. how many people visited the beach when the temperature was 84 degrees?
Answers: 1
Mathematics, 21.06.2019 18:00, duplerk30919
What is the difference between the predicted value and the actual value
Answers: 1
Mathematics, 21.06.2019 20:20, kenken2583
Complete the input-output table for the linear function y = 3x. complete the input-output table for the linear function y = 3x. a = b = c =
Answers: 2
You know the right answer?
Which of the following shows the graph of y = 2 l n x On a coordinate plane, a curve starts at (0, n...
Questions in other subjects:

Biology, 03.12.2020 22:40


Health, 03.12.2020 22:40
Biology, 03.12.2020 22:40

Geography, 03.12.2020 22:40

Arts, 03.12.2020 22:40


