
Mathematics, 04.07.2020 07:01 destinyycooper
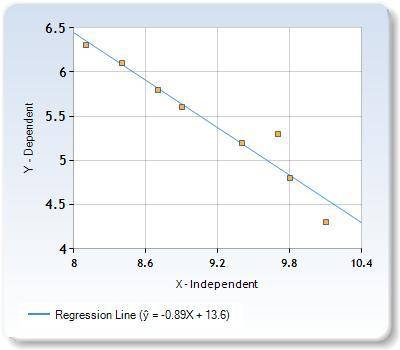
PLEASE HELP! Use a graphing calculator to find an equation of the line of best fit for the data in the table. Round the slope and y-intercept to the nearest tenth. Then Identify and interpret the correlation coefficient.
X- 10.1 9.8 9.7 9.4 8.9 8.7 8.4 8.1
Y- 4.3 4.8 5.3 5.2 5.6 5.8 6.1 6.3
The equation of the line of best fit is y=
To the nearest thousandth, the correlation coefficient is r=

Answers: 1

![\begin{array}{|c|cc|} \mathbf{Column \ 1}&&\mathbf{Column \ 2}\\10.1&&4.3\\9.8&&4.8\\9.7&&5.3\\9.4&&5.2\\8.9&&5.6\\8.7&&5.8\\8.4&&6.1\\8.1&&6.3\end{array}\right]](/tpl/images/0701/0726/56e05.png)


Other questions on the subject: Mathematics
Mathematics, 21.06.2019 14:00, breezyalanah
Find the average rate of change for f(x) = x2 − 3x − 10 from x = −5 to x = 10.
Answers: 1
Mathematics, 21.06.2019 17:00, cjd1214812148
The rectangle on the right is the image of the rectangle on the left. what transformation would result in this image? reflection rotation translation dilation
Answers: 2
Mathematics, 21.06.2019 18:00, chloejaylevesque
Jada has a monthly budget for her cell phone bill. last month she spent 120% of her budget, and the bill was 60$. what is jada’s monthly budget
Answers: 2
Mathematics, 21.06.2019 20:00, Clervoyantyvonne
Simplify (2^5/3^2)^4 a. 2^20/3^8 b. 2^9/3^8 c. 8^5/12^2 d. 2/3^2
Answers: 1
You know the right answer?
PLEASE HELP! Use a graphing calculator to find an equation of the line of best fit for the data in t...
Questions in other subjects:

English, 12.12.2020 17:00

Social Studies, 12.12.2020 17:00
Mathematics, 12.12.2020 17:00
Mathematics, 12.12.2020 17:00


Biology, 12.12.2020 17:00


