
Mathematics, 04.07.2020 04:01 beccadoyle0809
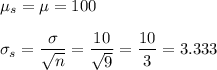
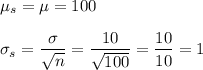
A random sample is selected from a population with mean and standard deviation . Determine the mean and standard deviation of the sampling distribution of for each of the following sample sizes:
a. n = 9
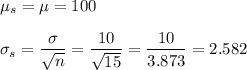
b. n = 15
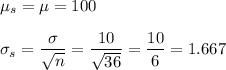
c. n = 36
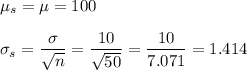
d. n = 50
e. n = 100
f. n = 400

Answers: 3


Other questions on the subject: Mathematics
Mathematics, 21.06.2019 15:00, vnzgirl
1. there are 25 students who started computer programming in elementary school and 25 students who started computer programming in middle school. the first group had a mean final project grade of 95% and the second group had a mean final project grade of 92%. the line plot shows the differences after 10 rerandomizations. determine whether the difference in the means of the two groups is significant based on the line plot. explain your answer.
Answers: 1
Mathematics, 21.06.2019 17:50, AdanNava699
Find the cosine function that is represented in the graph.
Answers: 1
Mathematics, 21.06.2019 20:30, dominaricann2451
When you have 25 numbers, and jake picks 3 random numbers and puts them back, what is the chance bob has of picking those 3 numbers when he picks 6 random numbers (without putting them back)? explain.
Answers: 1
Mathematics, 21.06.2019 23:00, koryhudson8124
How many heads would you expect if you flipped a coin twice? first, fill in the table below with the correct probabilities. hint: the sample space for flipping a coin twice is {hh, ht, th, tt}. a = b = c = f
Answers: 1
You know the right answer?
A random sample is selected from a population with mean and standard deviation . Determine the mean...
Questions in other subjects:

English, 08.10.2021 02:10


Spanish, 08.10.2021 02:10
Mathematics, 08.10.2021 02:10


