
Mathematics, 03.07.2020 23:01 minie66
These tables represent an exponential function. Find the average rate of
change for the interval from x = 7 to x = 8.
X
Interval
0
1
2.
у
1
3
9
27
81
243
729
Average rate
of change
2
]x3
6
]x3
18
4]x3
54
|]
162
1]x3
486
0 to 1
1 to 2
2 to 3
3 to 4
4 to 5
5 to 6
3
4
H
5
-
6
O A. 2187
O B. 4374
C. 6561
D. 3

Answers: 2


Other questions on the subject: Mathematics
Mathematics, 21.06.2019 19:00, jdkrisdaimcc11
Atheater wants to build movable steps that they can use to go on and off the stage. they want the steps to have enough space inside so they can also be used to store props. how much space is inside the steps?
Answers: 1
Mathematics, 21.06.2019 20:00, annieleblanc2004
Which type of graph would allow us to quickly see how many students between 100 and 200 students were treated?
Answers: 1
Mathematics, 21.06.2019 22:00, marissastewart533
Given sin∅ = 1/3 and 0 < ∅ < π/2 ; find tan2∅ a. (4√2)/9 b. 9/7 c. (4√2)/7 d.7/9
Answers: 2
Mathematics, 21.06.2019 22:30, kdtd3163
In a certain city, the hourly wage of workers on temporary employment contracts is normally distributed. the mean is $15 and the standard deviation is $3. what percentage of temporary workers earn less than $12 per hour? a. 6% b. 16% c. 26% d. 36%
Answers: 1
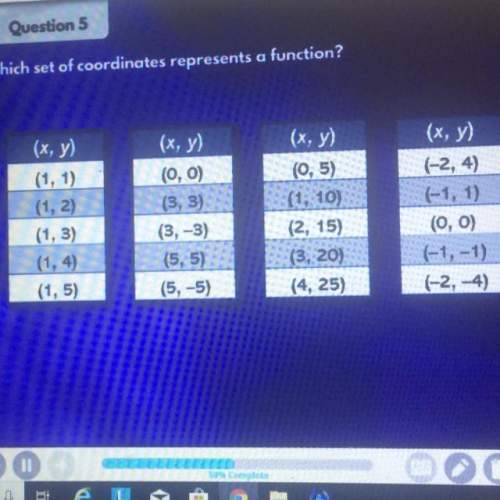
You know the right answer?
These tables represent an exponential function. Find the average rate of
change for the interval fr...
Questions in other subjects:


History, 24.11.2019 15:31
Mathematics, 24.11.2019 15:31
Mathematics, 24.11.2019 15:31


