
Mathematics, 03.07.2020 23:01 live4dramaoy0yf9
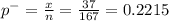
Identify the null hypothesis, alternative hypothesis, test statistic, P-value, conclusion about the null hypothesis, and final conclusion that addresses the original claim. In a sample of 167 children selected randomly from one town, it is found that 37 of them suffer from asthma. At the 0.05 significance level, test the claim that the proportion of all children in the town who suffer from asthma is 11%.

Answers: 2


Other questions on the subject: Mathematics
Mathematics, 21.06.2019 13:00, tae8002001
Three times the difference of federico’s age, and 4, increased by 7, is greater than 37. what are possible values of federico’s age?
Answers: 1
Mathematics, 21.06.2019 15:00, Shavaila18
The data shown in the table below represents the weight, in pounds, of a little girl, recorded each year on her birthday. age (in years) weight (in pounds) 2 32 6 47 7 51 4 40 5 43 3 38 8 60 1 23 part a: create a scatter plot to represent the data shown above. sketch the line of best fit. label at least three specific points on the graph that the line passes through. also include the correct labels on the x-axis and y-axis. part b: algebraically write the equation of the best fit line in slope-intercept form. include all of your calculations in your final answer. part c: use the equation for the line of best fit to approximate the weight of the little girl at an age of 14 years old.
Answers: 3
Mathematics, 21.06.2019 22:10, alishadautreuil
In which direction does the left side of the graph of this function point? a(x) = 3x - x2 + 4x - 2
Answers: 3
You know the right answer?
Identify the null hypothesis, alternative hypothesis, test statistic, P-value, conclusion about the...
Questions in other subjects:


English, 18.02.2020 04:52


