
Mathematics, 02.07.2020 23:01 aesthetickait
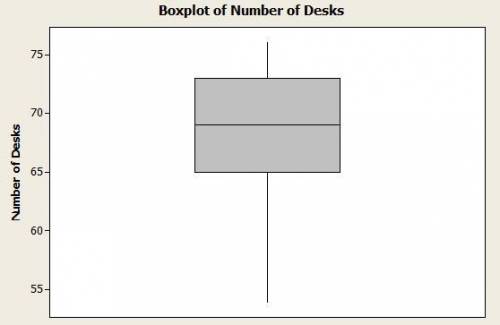
The data below represents the number of desks on each floor of Texter Corporate.
54, 60, 65, 66, 67, 69, 70, 72, 73, 75, 76
Which box plot correctly summarizes the data?
Choose 1
50
53
56
59
62
65
68
71
80
74 77
80
62
65
68
71
74
59
50
53
56
53
50
56
59
62 65 68 71 74 77 80

Answers: 3


Other questions on the subject: Mathematics
Mathematics, 21.06.2019 16:20, whitewesley124
Plot the points (0,6), (3,15.8), and (9.5,0) using the graphing tool, and find the function
Answers: 2
Mathematics, 21.06.2019 20:10, MikeWrice3615
What additional information could be used to prove abc =mqr using sas? check all that apply.
Answers: 1
Mathematics, 22.06.2019 00:30, winterblanco
1/2+1/6-3/4 simplify the given expression leaving the answer in improper fraction form.
Answers: 2
Mathematics, 22.06.2019 01:30, bellaforlife9
Amayoral candidate would like to know her residents’ views on a tax on sugar drinks before the mayoral debates. she asks one thousand registered voters from both parties. these voters are an example of a census population convenience sample simple random sample
Answers: 1
You know the right answer?
The data below represents the number of desks on each floor of Texter Corporate.
54, 60, 65, 66, 67...
Questions in other subjects:


Mathematics, 18.06.2021 22:30
Mathematics, 18.06.2021 22:30


